| Red | Green | Blue | |
| z | 17.64 | ||
| znorm | Inf | ||
| sky | -Inf | -NaN | -Inf |
| S/N | 26.5 | 45.0 | 47.6 |
| S/N(c) | 0.0 | 0.0 | 0.0 |
| SN(E/C) |
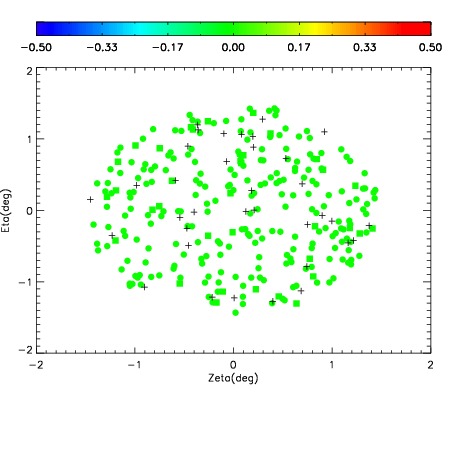
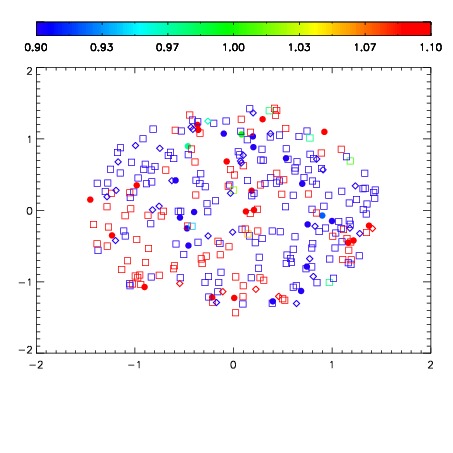


| Frame | Nreads | Zeropoints | Mag plots | Spatial mag deviation | Spatial sky 16325A emission deviations (filled: sky, open: star) | Spatial sky continuum emission | Spatial sky telluric CO2 absorption deviations (filled: H < 10) | |||||||||||||||||||||||
| 0 | 0 |
|
|
|
|
|
|
| IPAIR | NAME | SHIFT | NEWSHIFT | S/N | NAME | SHIFT | NEWSHIFT | S/N |
| 0 | 10250031 | 0.504722 | 0.00000 | 19.0835 | 10250030 | 0.00445208 | 0.500270 | 19.0369 |
| 1 | 10250032 | 0.504532 | 0.000190020 | 19.0990 | 10250033 | 0.00605095 | 0.498671 | 19.1246 |
| 2 | 10250027 | 0.502924 | 0.00179797 | 18.9601 | 10250029 | 0.00437886 | 0.500343 | 18.9990 |
| 3 | 10250028 | 0.503558 | 0.00116402 | 18.9261 | 10250026 | 0.00000 | 0.504722 | 18.9223 |