| Red | Green | Blue | |
| z | 17.64 | ||
| znorm | Inf | ||
| sky | -Inf | -NaN | -Inf |
| S/N | 24.9 | 43.3 | 45.3 |
| S/N(c) | 0.0 | 0.0 | 0.0 |
| SN(E/C) |
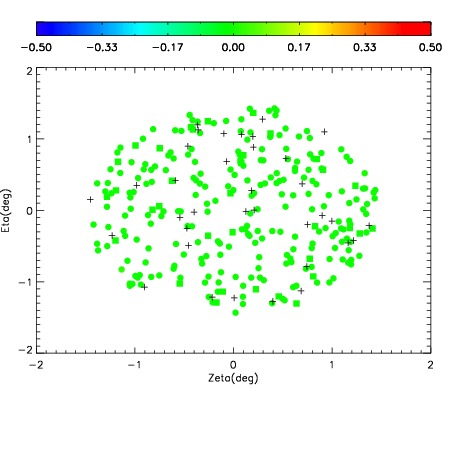
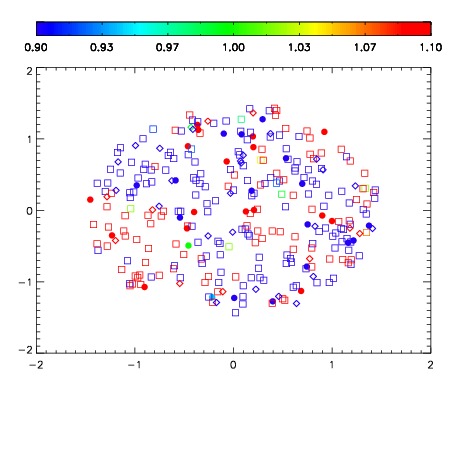
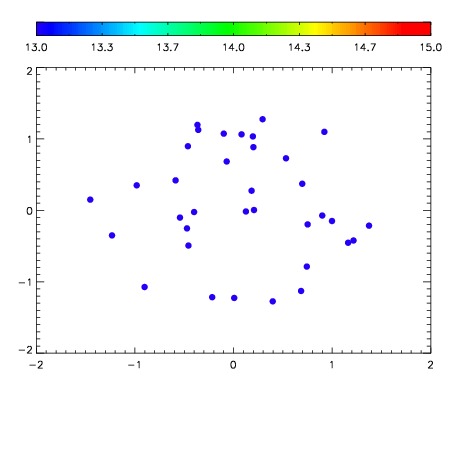

| Frame | Nreads | Zeropoints | Mag plots | Spatial mag deviation | Spatial sky 16325A emission deviations (filled: sky, open: star) | Spatial sky continuum emission | Spatial sky telluric CO2 absorption deviations (filled: H < 10) | |||||||||||||||||||||||
| 0 | 0 |
|
|
|
|
|
|
| IPAIR | NAME | SHIFT | NEWSHIFT | S/N | NAME | SHIFT | NEWSHIFT | S/N |
| 0 | 10460013 | 0.505323 | 0.00000 | 19.0086 | 10460014 | 0.00256342 | 0.502760 | 18.9903 |
| 1 | 10460012 | 0.505000 | 0.000322998 | 19.0079 | 10460011 | 0.00000 | 0.505323 | 18.9891 |
| 2 | 10460016 | 0.504604 | 0.000719011 | 18.9685 | 10460015 | 0.00211927 | 0.503204 | 18.9619 |
| 3 | 10460017 | 0.504995 | 0.000328004 | 18.8982 | 10460018 | 0.00402554 | 0.501297 | 18.9045 |