| Red | Green | Blue | |
| z | 17.64 | ||
| znorm | Inf | ||
| sky | -Inf | -NaN | -Inf |
| S/N | 30.2 | 49.9 | 53.6 |
| S/N(c) | 0.0 | 0.0 | 0.0 |
| SN(E/C) |

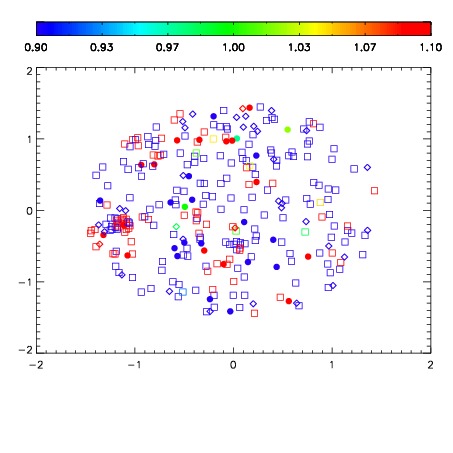


| Frame | Nreads | Zeropoints | Mag plots | Spatial mag deviation | Spatial sky 16325A emission deviations (filled: sky, open: star) | Spatial sky continuum emission | Spatial sky telluric CO2 absorption deviations (filled: H < 10) | |||||||||||||||||||||||
| 0 | 0 |
|
|
|
|
|
|
| IPAIR | NAME | SHIFT | NEWSHIFT | S/N | NAME | SHIFT | NEWSHIFT | S/N |
| 0 | 10220041 | 0.488471 | 0.00000 | 19.1706 | 10220042 | -0.000217681 | 0.488689 | 19.1519 |
| 1 | 10220044 | 0.487664 | 0.000806987 | 19.1509 | 10220046 | -0.00171014 | 0.490181 | 19.1417 |
| 2 | 10220040 | 0.487779 | 0.000692010 | 19.1388 | 10220043 | -7.42873e-05 | 0.488545 | 19.1258 |
| 3 | 10220045 | 0.488458 | 1.29938e-05 | 19.1255 | 10220039 | 0.00000 | 0.488471 | 19.1247 |