| Red | Green | Blue | |
| z | 17.64 | ||
| znorm | Inf | ||
| sky | -Inf | -NaN | -Inf |
| S/N | 30.7 | 51.4 | 54.4 |
| S/N(c) | 0.0 | 0.0 | 0.0 |
| SN(E/C) |
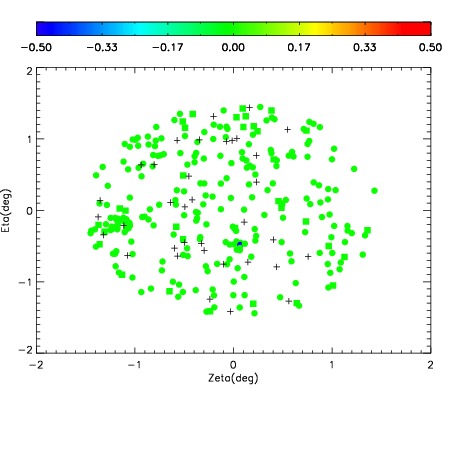

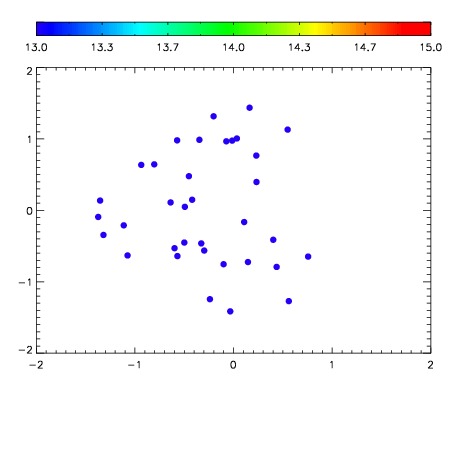

| Frame | Nreads | Zeropoints | Mag plots | Spatial mag deviation | Spatial sky 16325A emission deviations (filled: sky, open: star) | Spatial sky continuum emission | Spatial sky telluric CO2 absorption deviations (filled: H < 10) | |||||||||||||||||||||||
| 0 | 0 |
|
|
|
|
|
|
| IPAIR | NAME | SHIFT | NEWSHIFT | S/N | NAME | SHIFT | NEWSHIFT | S/N |
| 0 | 10260038 | 0.488781 | 0.00000 | 19.2212 | 10260040 | -0.00106519 | 0.489846 | 19.2076 |
| 1 | 10260041 | 0.487109 | 0.00167200 | 19.2033 | 10260043 | -0.00102235 | 0.489803 | 19.2074 |
| 2 | 10260042 | 0.487269 | 0.00151199 | 19.1957 | 10260039 | -0.000861585 | 0.489643 | 19.1729 |
| 3 | 10260037 | 0.488380 | 0.000400990 | 19.1603 | 10260036 | 0.00000 | 0.488781 | 19.1270 |