| Red | Green | Blue | |
| z | 17.64 | ||
| znorm | Inf | ||
| sky | -Inf | -Inf | -Inf |
| S/N | 27.3 | 45.7 | 48.0 |
| S/N(c) | 0.0 | 0.0 | 0.0 |
| SN(E/C) |
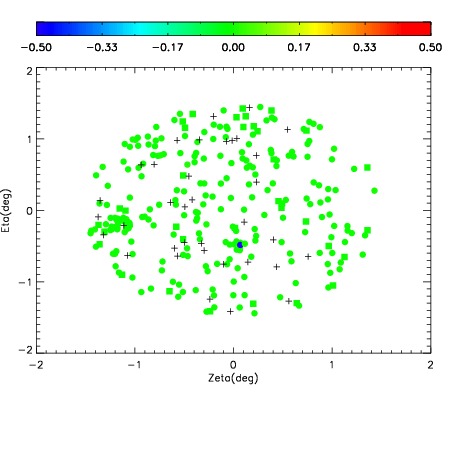
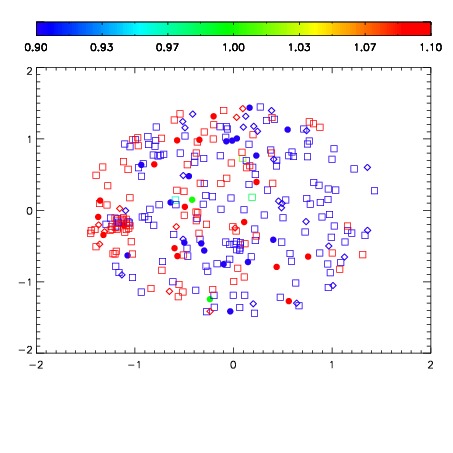
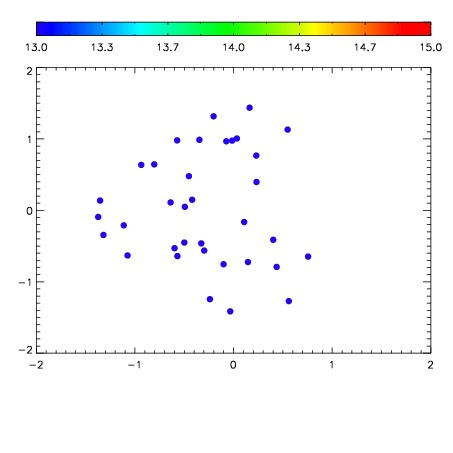

| Frame | Nreads | Zeropoints | Mag plots | Spatial mag deviation | Spatial sky 16325A emission deviations (filled: sky, open: star) | Spatial sky continuum emission | Spatial sky telluric CO2 absorption deviations (filled: H < 10) | |||||||||||||||||||||||
| 0 | 0 |
|
|
|
|
|
|
| IPAIR | NAME | SHIFT | NEWSHIFT | S/N | NAME | SHIFT | NEWSHIFT | S/N |
| 0 | 10540028 | 0.502043 | 0.00000 | 18.8793 | 10540033 | 0.00186115 | 0.500182 | 18.9339 |
| 1 | 10540027 | 0.501945 | 9.79900e-05 | 19.0520 | 10540026 | 0.00000 | 0.502043 | 19.0622 |
| 2 | 10540032 | 0.501621 | 0.000422001 | 18.9397 | 10540029 | 0.00509620 | 0.496947 | 19.0406 |
| 3 | 10540031 | 0.501073 | 0.000970006 | 18.8180 | 10540030 | 0.00445340 | 0.497590 | 18.9278 |