| Red | Green | Blue | |
| z | 17.64 | ||
| znorm | Inf | ||
| sky | -NaN | -NaN | -NaN |
| S/N | 31.6 | 52.1 | 54.3 |
| S/N(c) | 0.0 | 0.0 | 0.0 |
| SN(E/C) |


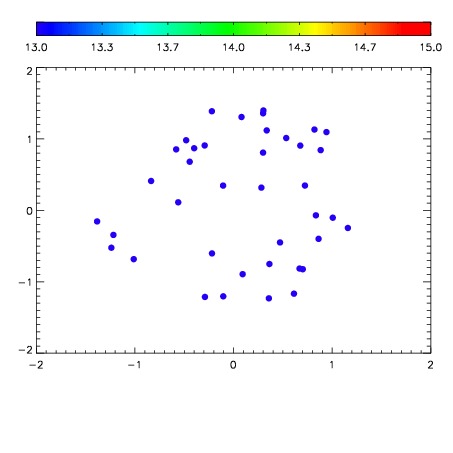

| Frame | Nreads | Zeropoints | Mag plots | Spatial mag deviation | Spatial sky 16325A emission deviations (filled: sky, open: star) | Spatial sky continuum emission | Spatial sky telluric CO2 absorption deviations (filled: H < 10) | |||||||||||||||||||||||
| 0 | 0 |
|
|
|
|
|
|
| IPAIR | NAME | SHIFT | NEWSHIFT | S/N | NAME | SHIFT | NEWSHIFT | S/N |
| 0 | 09720027 | 0.517628 | 0.00000 | 19.2168 | 09720029 | 0.000440915 | 0.517187 | 19.2212 |
| 1 | 09720030 | 0.514267 | 0.00336099 | 19.2589 | 09720032 | -0.000282190 | 0.517910 | 19.2315 |
| 2 | 09720031 | 0.514608 | 0.00301999 | 19.2329 | 09720028 | 0.00117693 | 0.516451 | 19.2306 |
| 3 | 09720026 | 0.516913 | 0.000715017 | 19.1996 | 09720025 | 0.00000 | 0.517628 | 19.1933 |