| Red | Green | Blue | |
| z | 17.64 | ||
| znorm | Inf | ||
| sky | -NaN | -NaN | -Inf |
| S/N | 18.5 | 34.4 | 35.4 |
| S/N(c) | 0.0 | 0.0 | 0.0 |
| SN(E/C) |


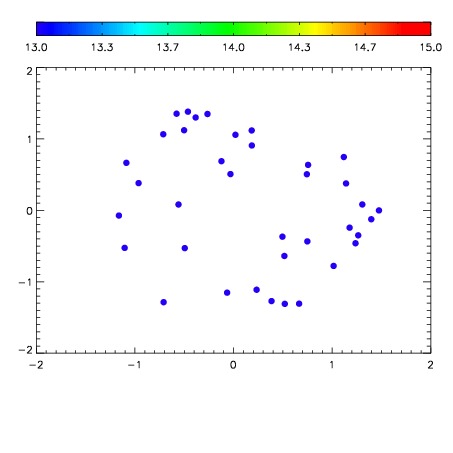

| Frame | Nreads | Zeropoints | Mag plots | Spatial mag deviation | Spatial sky 16325A emission deviations (filled: sky, open: star) | Spatial sky continuum emission | Spatial sky telluric CO2 absorption deviations (filled: H < 10) | |||||||||||||||||||||||
| 0 | 0 |
|
|
|
|
|
|
| IPAIR | NAME | SHIFT | NEWSHIFT | S/N | NAME | SHIFT | NEWSHIFT | S/N |
| 0 | 06960028 | 0.490490 | 0.00000 | 18.0072 | 06960037 | 0.00550953 | 0.484980 | 17.8628 |
| 1 | 06960035 | 0.488670 | 0.00182000 | 18.4812 | 06960033 | 0.00418552 | 0.486304 | 18.5088 |
| 2 | 06960032 | 0.488654 | 0.00183600 | 18.4069 | 06960034 | 0.00461524 | 0.485875 | 18.4635 |
| 3 | 06960036 | 0.489164 | 0.00132599 | 18.1641 | 06960029 | 0.00384174 | 0.486648 | 18.1375 |
| 4 | 06960031 | 0.488263 | 0.00222698 | 18.0559 | 06960026 | 0.00000 | 0.490490 | 18.1193 |
| 5 | 06960027 | 0.489985 | 0.000505000 | 18.0364 | 06960030 | 0.00201734 | 0.488473 | 18.1170 |