| Red | Green | Blue | |
| z | 17.64 | ||
| znorm | Inf | ||
| sky | -Inf | -NaN | -Inf |
| S/N | 27.0 | 46.8 | 48.5 |
| S/N(c) | 0.0 | 0.0 | 0.0 |
| SN(E/C) |
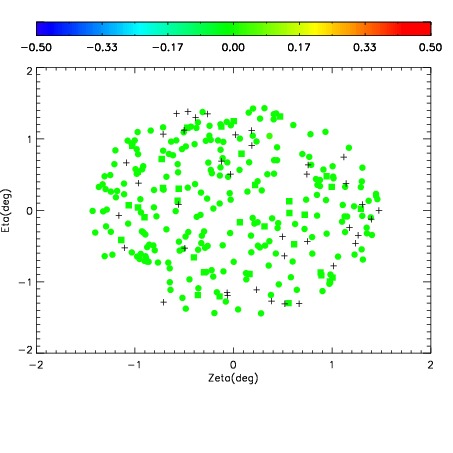
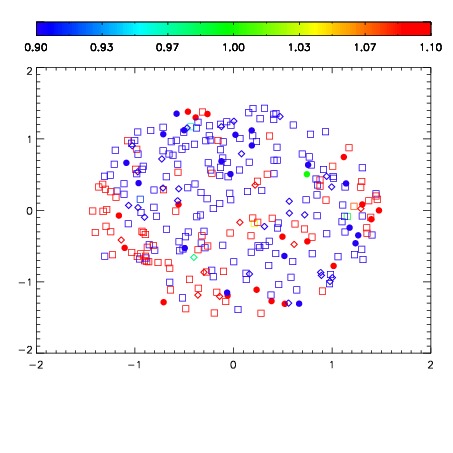
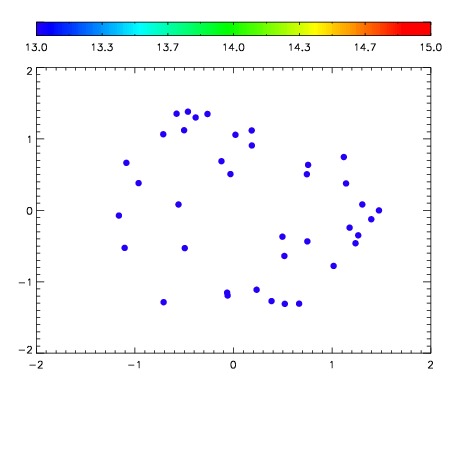

| Frame | Nreads | Zeropoints | Mag plots | Spatial mag deviation | Spatial sky 16325A emission deviations (filled: sky, open: star) | Spatial sky continuum emission | Spatial sky telluric CO2 absorption deviations (filled: H < 10) | |||||||||||||||||||||||
| 0 | 0 |
|
|
|
|
|
|
| IPAIR | NAME | SHIFT | NEWSHIFT | S/N | NAME | SHIFT | NEWSHIFT | S/N |
| 0 | 07000028 | 0.480406 | 0.00000 | 19.0113 | 07000022 | 0.00000 | 0.480406 | 18.9972 |
| 1 | 07000024 | 0.478836 | 0.00156999 | 19.0870 | 07000025 | 0.00235911 | 0.478047 | 19.0846 |
| 2 | 07000023 | 0.477806 | 0.00259998 | 19.0785 | 07000026 | 0.00244273 | 0.477963 | 19.0734 |
| 3 | 07000027 | 0.478504 | 0.00190198 | 19.0635 | 07000029 | 0.00212942 | 0.478277 | 19.0479 |