| Red | Green | Blue | |
| z | 17.64 | ||
| znorm | Inf | ||
| sky | -Inf | -Inf | -Inf |
| S/N | 27.5 | 45.8 | 48.6 |
| S/N(c) | 0.0 | 0.0 | 0.0 |
| SN(E/C) |
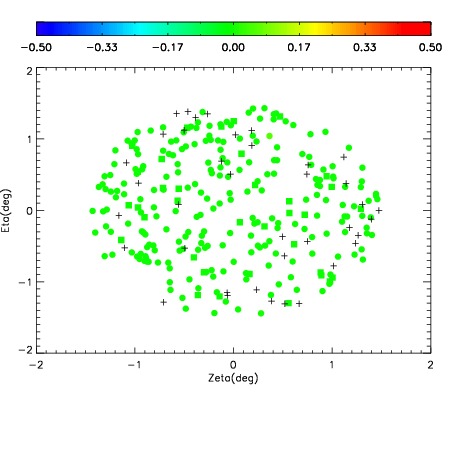
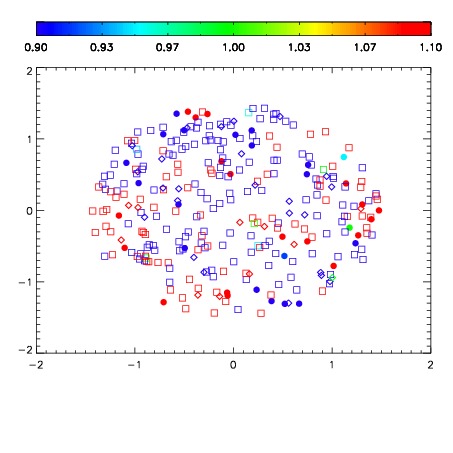
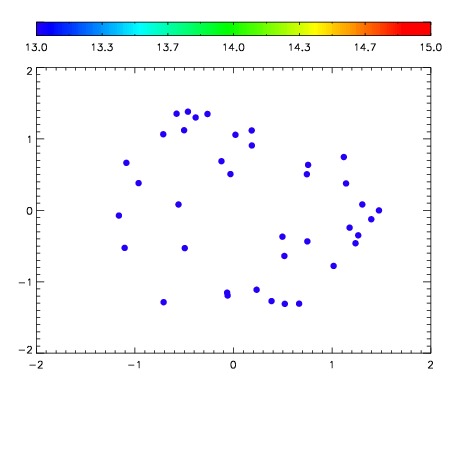

| Frame | Nreads | Zeropoints | Mag plots | Spatial mag deviation | Spatial sky 16325A emission deviations (filled: sky, open: star) | Spatial sky continuum emission | Spatial sky telluric CO2 absorption deviations (filled: H < 10) | |||||||||||||||||||||||
| 0 | 0 |
|
|
|
|
|
|
| IPAIR | NAME | SHIFT | NEWSHIFT | S/N | NAME | SHIFT | NEWSHIFT | S/N |
| 0 | 07230017 | 0.484116 | 0.00000 | 18.9736 | 07230015 | -0.000573249 | 0.484689 | 18.9685 |
| 1 | 07230013 | 0.477178 | 0.00693798 | 19.0297 | 07230018 | 0.000269434 | 0.483847 | 19.0179 |
| 2 | 07230016 | 0.483337 | 0.000779003 | 18.9940 | 07230011 | 0.00000 | 0.484116 | 19.0110 |
| 3 | 07230012 | 0.476205 | 0.00791100 | 18.9868 | 07230014 | -2.35547e-05 | 0.484140 | 18.9843 |