| Red | Green | Blue | |
| z | 17.64 | ||
| znorm | Inf | ||
| sky | -Inf | -Inf | -Inf |
| S/N | 10.1 | 17.7 | 18.8 |
| S/N(c) | 0.0 | 0.0 | 0.0 |
| SN(E/C) |

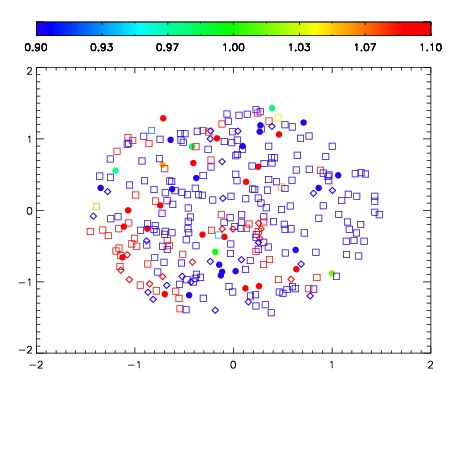


| Frame | Nreads | Zeropoints | Mag plots | Spatial mag deviation | Spatial sky 16325A emission deviations (filled: sky, open: star) | Spatial sky continuum emission | Spatial sky telluric CO2 absorption deviations (filled: H < 10) | |||||||||||||||||||||||
| 0 | 0 |
|
|
|
|
|
|
| IPAIR | NAME | SHIFT | NEWSHIFT | S/N | NAME | SHIFT | NEWSHIFT | S/N |
| 0 | 10270060 | 0.499182 | 0.00000 | 16.8394 | 10270059 | 0.00199506 | 0.497187 | 15.5862 |
| 1 | 10270056 | 0.495224 | 0.00395799 | 18.2701 | 10270055 | 0.00000 | 0.499182 | 18.5517 |
| 2 | 10270057 | 0.495551 | 0.00363100 | 17.9375 | 10270058 | 0.00190281 | 0.497279 | 16.1459 |
| 3 | 10270061 | 0.499154 | 2.79844e-05 | 15.0376 | 10270062 | 0.000955108 | 0.498227 | 13.8849 |