| Red | Green | Blue | |
| z | 17.64 | ||
| znorm | Inf | ||
| sky | -Inf | -Inf | -Inf |
| S/N | 28.6 | 45.0 | 51.7 |
| S/N(c) | 0.0 | 0.0 | 0.0 |
| SN(E/C) |

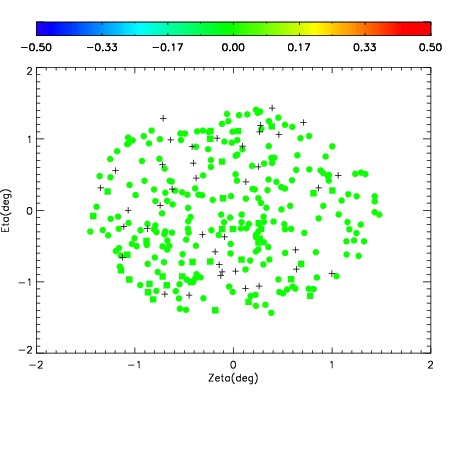
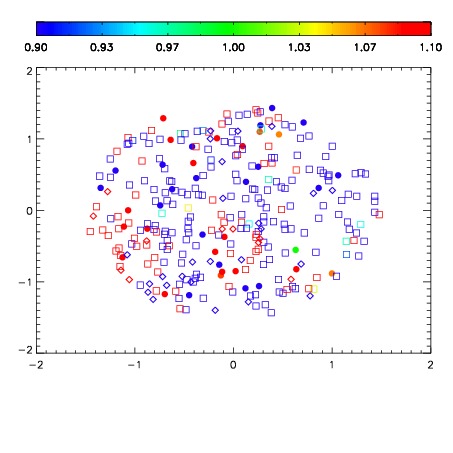


| Frame | Nreads | Zeropoints | Mag plots | Spatial mag deviation | Spatial sky 16325A emission deviations (filled: sky, open: star) | Spatial sky continuum emission | Spatial sky telluric CO2 absorption deviations (filled: H < 10) | |||||||||||||||||||||||
| 0 | 0 |
|
|
|
|
|
|
| IPAIR | NAME | SHIFT | NEWSHIFT | S/N | NAME | SHIFT | NEWSHIFT | S/N |
| 0 | 10450049 | 0.505649 | 0.00000 | 19.1402 | 10450054 | 0.00102423 | 0.504625 | 19.1510 |
| 1 | 10450053 | 0.503710 | 0.00193900 | 19.1675 | 10450051 | 0.000256238 | 0.505393 | 19.1566 |
| 2 | 10450052 | 0.503640 | 0.00200897 | 19.1081 | 10450050 | 0.000600609 | 0.505048 | 19.1326 |
| 3 | 10450048 | 0.505442 | 0.000206947 | 19.0513 | 10450047 | 0.00000 | 0.505649 | 18.9712 |