| Red | Green | Blue | |
| z | 17.64 | ||
| znorm | Inf | ||
| sky | -Inf | -Inf | -Inf |
| S/N | 29.5 | 48.6 | 55.1 |
| S/N(c) | 0.0 | 0.0 | 0.0 |
| SN(E/C) |


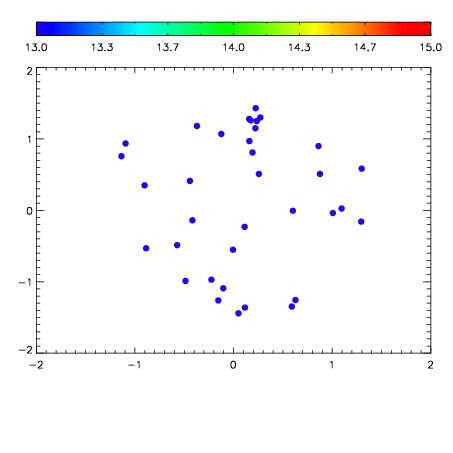

| Frame | Nreads | Zeropoints | Mag plots | Spatial mag deviation | Spatial sky 16325A emission deviations (filled: sky, open: star) | Spatial sky continuum emission | Spatial sky telluric CO2 absorption deviations (filled: H < 10) | |||||||||||||||||||||||
| 0 | 0 |
|
|
|
|
|
|
| IPAIR | NAME | SHIFT | NEWSHIFT | S/N | NAME | SHIFT | NEWSHIFT | S/N |
| 0 | 03760016 | 0.503348 | 0.00000 | 18.7542 | 03760010 | 0.00000 | 0.503348 | 18.6585 |
| 1 | 03760011 | 0.497995 | 0.00535300 | 19.0732 | 03760018 | -0.00858030 | 0.511928 | 19.0851 |
| 2 | 03760012 | 0.500123 | 0.00322497 | 18.8403 | 03760017 | -0.00451824 | 0.507866 | 18.9335 |
| 3 | 03760019 | 0.498779 | 0.00456899 | 18.8119 | 03760013 | -0.000844933 | 0.504193 | 18.8862 |
| 4 | 03760020 | 0.501558 | 0.00178999 | 18.5995 | 03760021 | -0.00375277 | 0.507101 | 18.5501 |
| 5 | 03760015 | 0.498716 | 0.00463200 | 18.3110 | 03760014 | -0.00281452 | 0.506163 | 18.5238 |