| Red | Green | Blue | |
| z | 17.64 | ||
| znorm | Inf | ||
| sky | -Inf | -Inf | -Inf |
| S/N | 28.8 | 49.7 | 52.8 |
| S/N(c) | 0.0 | 0.0 | 0.0 |
| SN(E/C) |
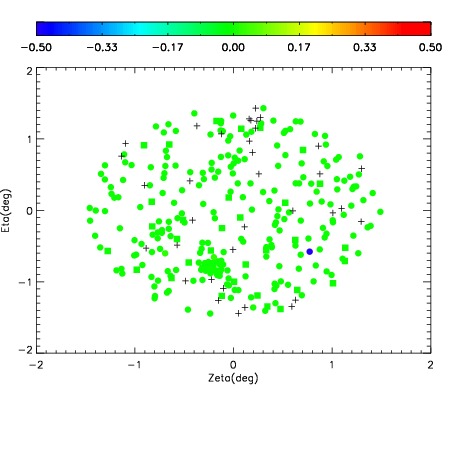
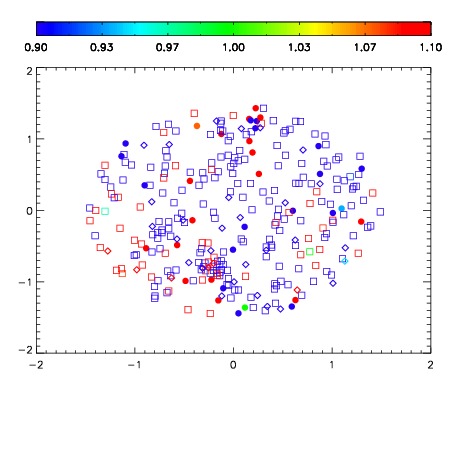
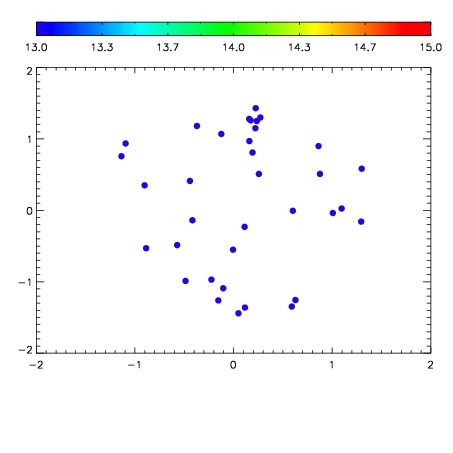

| Frame | Nreads | Zeropoints | Mag plots | Spatial mag deviation | Spatial sky 16325A emission deviations (filled: sky, open: star) | Spatial sky continuum emission | Spatial sky telluric CO2 absorption deviations (filled: H < 10) | |||||||||||||||||||||||
| 0 | 0 |
|
|
|
|
|
|
| IPAIR | NAME | SHIFT | NEWSHIFT | S/N | NAME | SHIFT | NEWSHIFT | S/N |
| 0 | 09980050 | 0.520853 | 0.00000 | 19.2311 | 09980051 | 7.15472e-05 | 0.520781 | 19.2012 |
| 1 | 09980054 | 0.520175 | 0.000678003 | 19.2443 | 09980055 | -0.00213924 | 0.522992 | 19.2106 |
| 2 | 09980053 | 0.520749 | 0.000104010 | 19.2394 | 09980052 | -0.000156941 | 0.521010 | 19.2099 |
| 3 | 09980049 | 0.520708 | 0.000144958 | 19.1817 | 09980048 | 0.00000 | 0.520853 | 18.9356 |