| Red | Green | Blue | |
| z | 17.64 | ||
| znorm | Inf | ||
| sky | -Inf | -NaN | -Inf |
| S/N | 33.0 | 56.6 | 61.9 |
| S/N(c) | 0.0 | 0.0 | 0.0 |
| SN(E/C) |
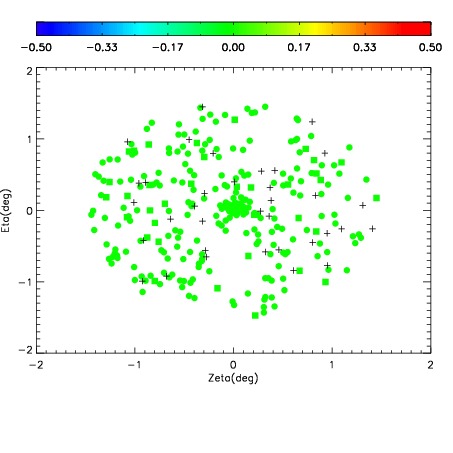
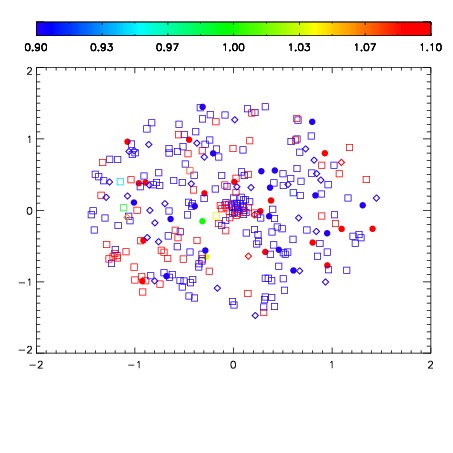
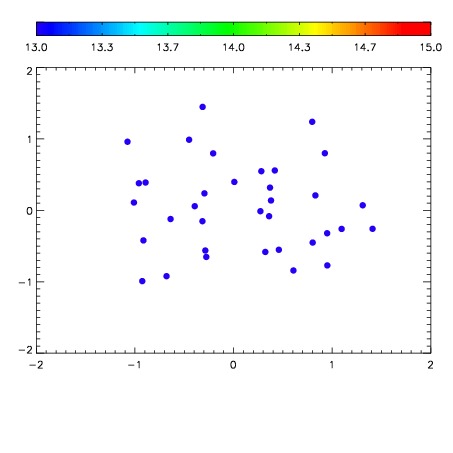

| Frame | Nreads | Zeropoints | Mag plots | Spatial mag deviation | Spatial sky 16325A emission deviations (filled: sky, open: star) | Spatial sky continuum emission | Spatial sky telluric CO2 absorption deviations (filled: H < 10) | |||||||||||||||||||||||
| 0 | 0 |
|
|
|
|
|
|
| IPAIR | NAME | SHIFT | NEWSHIFT | S/N | NAME | SHIFT | NEWSHIFT | S/N |
| 0 | 03410094 | 0.498076 | 0.00000 | 18.9728 | 03410096 | 0.000672493 | 0.497404 | 19.0891 |
| 1 | 03410093 | 0.494742 | 0.00333399 | 19.1380 | 03410100 | -0.00101680 | 0.499093 | 19.1287 |
| 2 | 03410098 | 0.492578 | 0.00549799 | 19.1311 | 03410099 | -0.000396608 | 0.498473 | 19.1245 |
| 3 | 03410097 | 0.489163 | 0.00891298 | 19.0752 | 03410095 | -0.000474870 | 0.498551 | 19.1173 |
| 4 | 03410102 | 0.491302 | 0.00677398 | 18.9775 | 03410092 | 0.00000 | 0.498076 | 19.0992 |