| Red | Green | Blue | |
| z | 17.64 | ||
| znorm | Inf | ||
| sky | -Inf | -NaN | -Inf |
| S/N | 18.8 | 35.4 | 37.6 |
| S/N(c) | 0.0 | 0.0 | 0.0 |
| SN(E/C) |
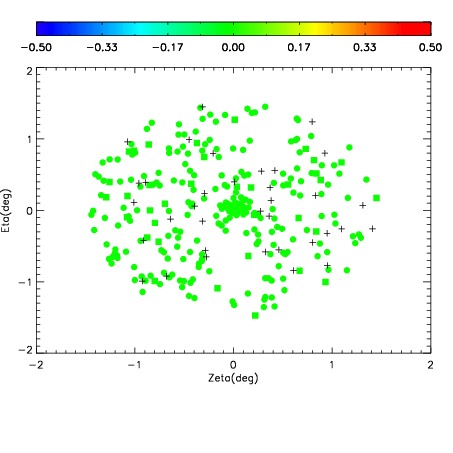
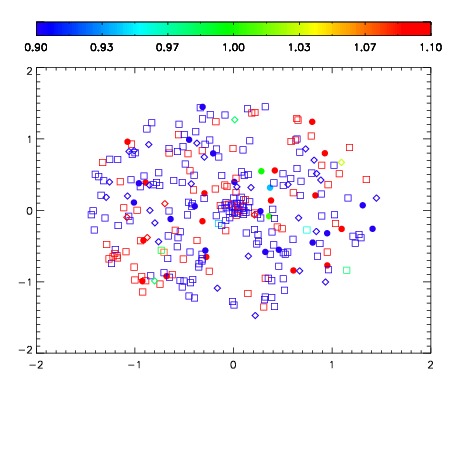
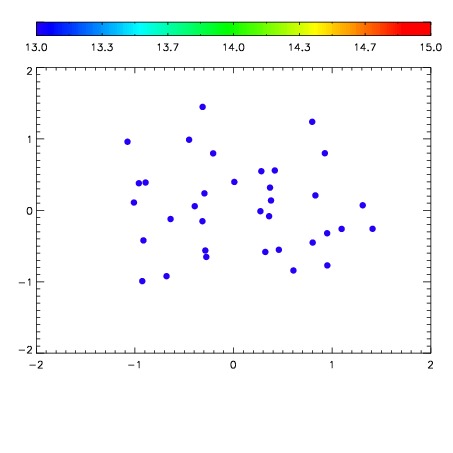

| Frame | Nreads | Zeropoints | Mag plots | Spatial mag deviation | Spatial sky 16325A emission deviations (filled: sky, open: star) | Spatial sky continuum emission | Spatial sky telluric CO2 absorption deviations (filled: H < 10) | |||||||||||||||||||||||
| 0 | 0 |
|
|
|
|
|
|
| IPAIR | NAME | SHIFT | NEWSHIFT | S/N | NAME | SHIFT | NEWSHIFT | S/N |
| 0 | 03680073 | 0.497801 | 0.00000 | 19.0489 | 03680074 | 0.000200101 | 0.497601 | 19.0858 |
| 1 | 03680072 | 0.494715 | 0.00308600 | 18.9890 | 03680078 | -0.000161186 | 0.497962 | 19.0121 |
| 2 | 03680076 | 0.491363 | 0.00643802 | 18.9782 | 03680075 | -0.00162003 | 0.499421 | 18.9949 |
| 3 | 03680077 | 0.495666 | 0.00213501 | 18.9653 | 03680071 | 0.00000 | 0.497801 | 18.8453 |