| Red | Green | Blue | |
| z | 17.64 | ||
| znorm | Inf | ||
| sky | -NaN | -Inf | -NaN |
| S/N | 34.3 | 58.8 | 65.0 |
| S/N(c) | 0.0 | 0.0 | 0.0 |
| SN(E/C) |
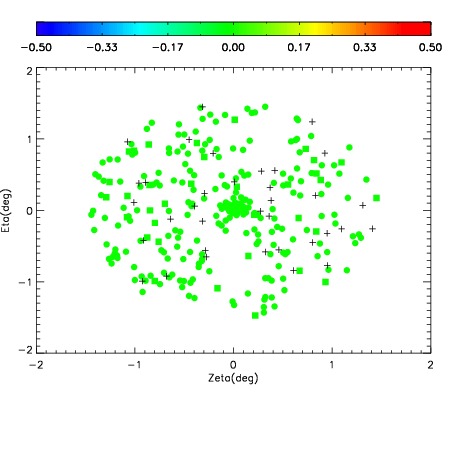
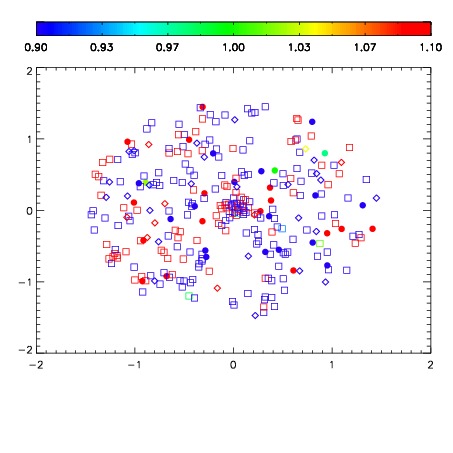
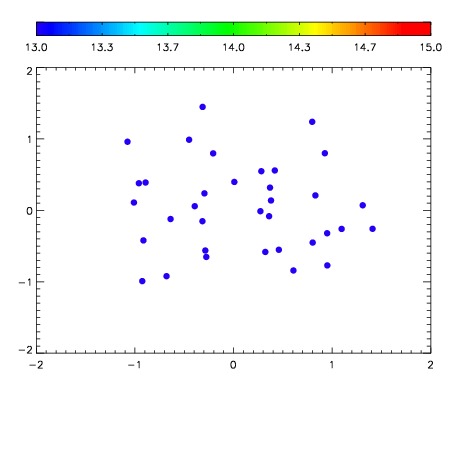

| Frame | Nreads | Zeropoints | Mag plots | Spatial mag deviation | Spatial sky 16325A emission deviations (filled: sky, open: star) | Spatial sky continuum emission | Spatial sky telluric CO2 absorption deviations (filled: H < 10) | |||||||||||||||||||||||
| 0 | 0 |
|
|
|
|
|
|
| IPAIR | NAME | SHIFT | NEWSHIFT | S/N | NAME | SHIFT | NEWSHIFT | S/N |
| 0 | 03720077 | 0.512255 | 0.00000 | 19.1048 | 03720075 | 0.00310979 | 0.509145 | 19.1659 |
| 1 | 03720081 | 0.510380 | 0.00187498 | 19.2191 | 03720082 | 0.000682944 | 0.511572 | 19.1959 |
| 2 | 03720080 | 0.509728 | 0.00252700 | 19.1811 | 03720074 | 0.00739428 | 0.504861 | 19.1921 |
| 3 | 03720073 | 0.504932 | 0.00732303 | 19.1286 | 03720079 | -0.000212714 | 0.512468 | 19.1890 |
| 4 | 03720076 | 0.510456 | 0.00179899 | 19.0892 | 03720071 | 0.00000 | 0.512255 | 19.1281 |
| 5 | 03720072 | 0.501614 | 0.0106410 | 18.9898 | 03720078 | 0.00141400 | 0.510841 | 19.0494 |