| Red | Green | Blue | |
| z | 17.64 | ||
| znorm | Inf | ||
| sky | -Inf | -Inf | -Inf |
| S/N | 21.1 | 37.1 | 39.3 |
| S/N(c) | 0.0 | 0.0 | 0.0 |
| SN(E/C) |
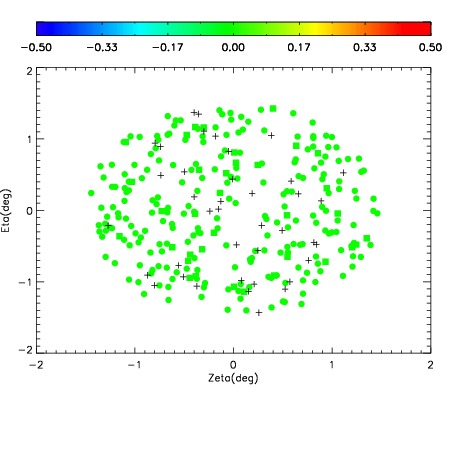
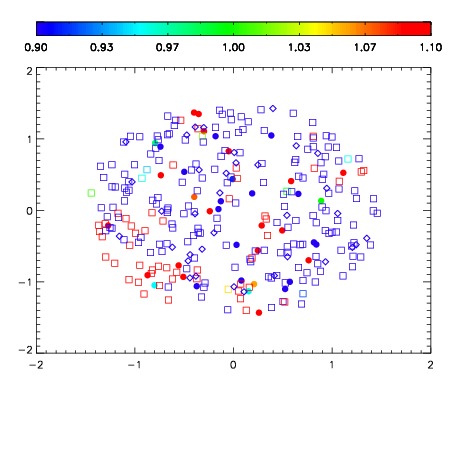


| Frame | Nreads | Zeropoints | Mag plots | Spatial mag deviation | Spatial sky 16325A emission deviations (filled: sky, open: star) | Spatial sky continuum emission | Spatial sky telluric CO2 absorption deviations (filled: H < 10) | |||||||||||||||||||||||
| 0 | 0 |
|
|
|
|
|
|
| IPAIR | NAME | SHIFT | NEWSHIFT | S/N | NAME | SHIFT | NEWSHIFT | S/N |
| 0 | 03440078 | 0.514862 | 0.00000 | 18.3157 | 03440079 | 0.00167355 | 0.513188 | 17.3633 |
| 1 | 03440074 | 0.513299 | 0.00156301 | 19.0298 | 03440075 | 0.00136177 | 0.513500 | 19.0168 |
| 2 | 03440073 | 0.507124 | 0.00773799 | 18.9500 | 03440072 | 0.00000 | 0.514862 | 18.9742 |
| 3 | 03440077 | 0.509356 | 0.00550598 | 18.4078 | 03440076 | 0.00156707 | 0.513295 | 18.9012 |