| Red | Green | Blue | |
| z | 17.64 | ||
| znorm | Inf | ||
| sky | -Inf | -Inf | -Inf |
| S/N | 25.1 | 44.4 | 47.2 |
| S/N(c) | 0.0 | 0.0 | 0.0 |
| SN(E/C) |
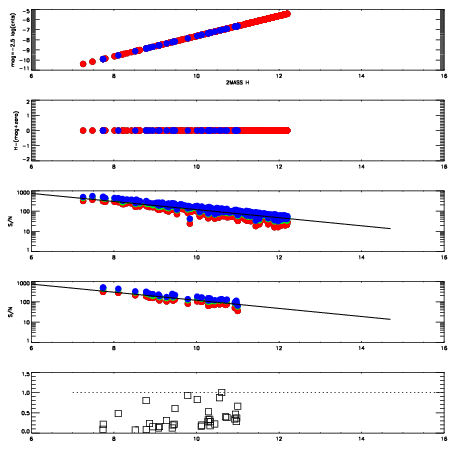
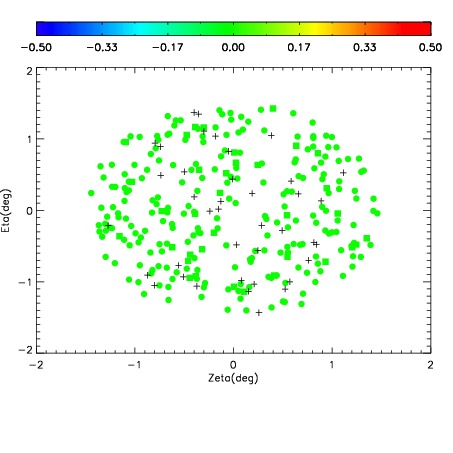

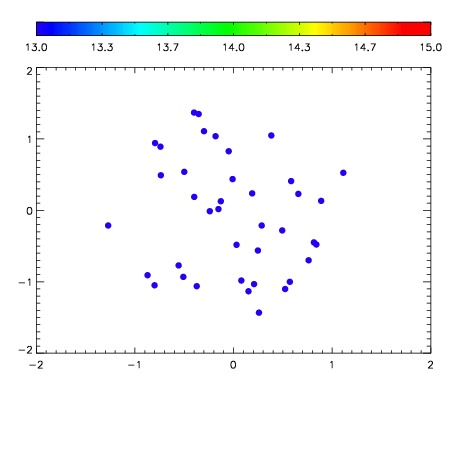

| Frame | Nreads | Zeropoints | Mag plots | Spatial mag deviation | Spatial sky 16325A emission deviations (filled: sky, open: star) | Spatial sky continuum emission | Spatial sky telluric CO2 absorption deviations (filled: H < 10) | |||||||||||||||||||||||
| 0 | 0 |
|
|
|
|
|
|
| IPAIR | NAME | SHIFT | NEWSHIFT | S/N | NAME | SHIFT | NEWSHIFT | S/N |
| 0 | 04560015 | 0.498944 | 0.00000 | 18.9880 | 04560010 | 0.00000 | 0.498944 | 19.0447 |
| 1 | 04560016 | 0.498491 | 0.000453025 | 19.1358 | 04560017 | 0.00210861 | 0.496835 | 19.1830 |
| 2 | 04560012 | 0.497285 | 0.00165901 | 19.0531 | 04560014 | 0.00164665 | 0.497297 | 19.0779 |
| 3 | 04560011 | 0.496506 | 0.00243801 | 19.0313 | 04560013 | 0.00348167 | 0.495462 | 19.0727 |