| Red | Green | Blue | |
| z | 17.64 | ||
| znorm | Inf | ||
| sky | -NaN | -Inf | -Inf |
| S/N | 27.3 | 48.8 | 53.2 |
| S/N(c) | 0.0 | 0.0 | 0.0 |
| SN(E/C) |
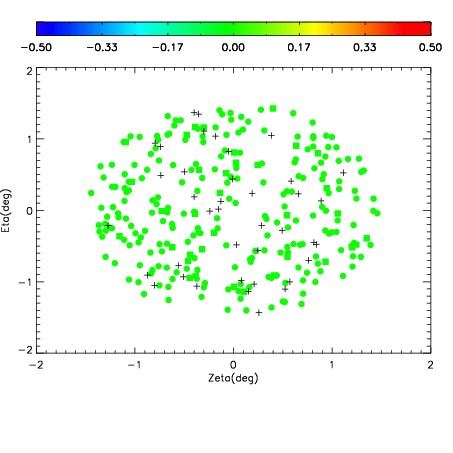
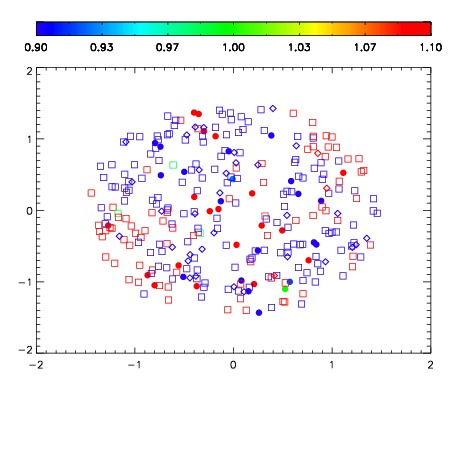
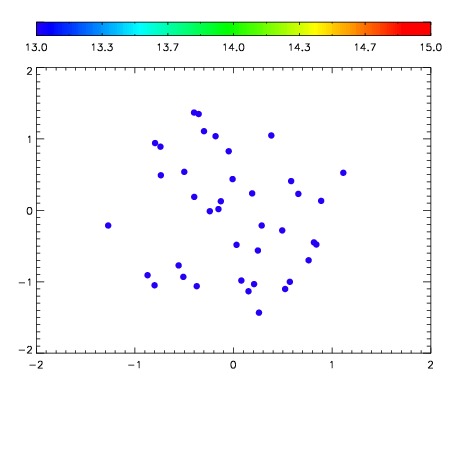

| Frame | Nreads | Zeropoints | Mag plots | Spatial mag deviation | Spatial sky 16325A emission deviations (filled: sky, open: star) | Spatial sky continuum emission | Spatial sky telluric CO2 absorption deviations (filled: H < 10) | |||||||||||||||||||||||
| 0 | 0 |
|
|
|
|
|
|
| IPAIR | NAME | SHIFT | NEWSHIFT | S/N | NAME | SHIFT | NEWSHIFT | S/N |
| 0 | 10820093 | 0.488788 | 0.00000 | 18.9800 | 10820087 | 0.00000 | 0.488788 | 18.8942 |
| 1 | 10820092 | 0.488376 | 0.000412017 | 19.0422 | 10820091 | -0.000942114 | 0.489730 | 19.0249 |
| 2 | 10820089 | 0.488010 | 0.000778019 | 19.0130 | 10820090 | -0.000767272 | 0.489555 | 19.0056 |
| 3 | 10820088 | 0.487164 | 0.00162402 | 18.9532 | 10820094 | -0.00232174 | 0.491110 | 18.6585 |
| 4 | 10820096 | 0.488061 | 0.000726998 | 18.6296 | 10820095 | -0.00205543 | 0.490843 | 18.4640 |