| Red | Green | Blue | |
| z | 17.63 | ||
| znorm | Inf | ||
| sky | -Inf | -NaN | -NaN |
| S/N | 21.8 | 40.2 | 41.3 |
| S/N(c) | 21.1 | 53.2 | 112.1 |
| SN(E/C) |
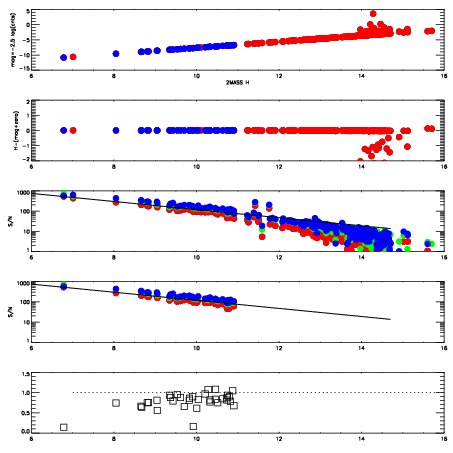
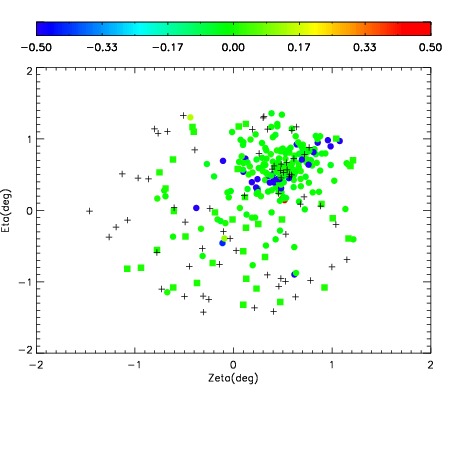
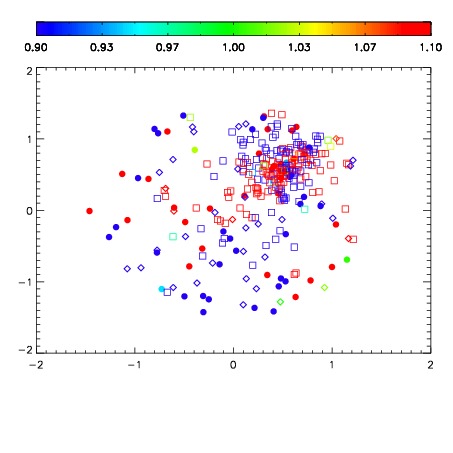
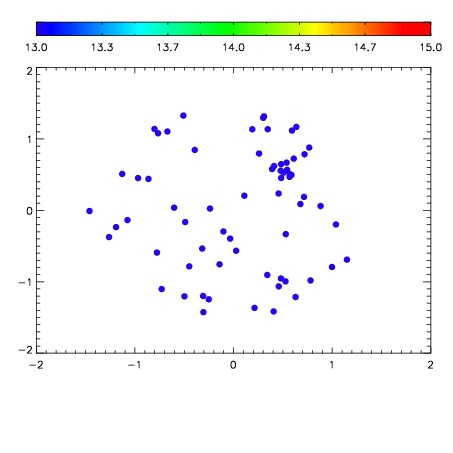

| Frame | Nreads | Zeropoints | Mag plots | Spatial mag deviation | Spatial sky 16325A emission deviations (filled: sky, open: star) | Spatial sky continuum emission | Spatial sky telluric CO2 absorption deviations (filled: H < 10) | |||||||||||||||||||||||
| 0 | 0 |
|
|
|
|
|
|
| IPAIR | NAME | SHIFT | NEWSHIFT | S/N | NAME | SHIFT | NEWSHIFT | S/N |
| 0 | 03340038 | 0.508907 | 0.00000 | 18.5968 | 03340039 | 0.00253554 | 0.506371 | 18.5860 |
| 1 | 03340037 | 0.507961 | 0.000946045 | 18.6022 | 03340036 | 0.00000 | 0.508907 | 18.6397 |
| 2 | 03340041 | 0.505377 | 0.00353003 | 18.5935 | 03340040 | 0.00215347 | 0.506754 | 18.5767 |
| 3 | 03340042 | 0.506664 | 0.00224304 | 18.5132 | 03340043 | 0.00317326 | 0.505734 | 18.1645 |