| Red | Green | Blue | |
| z | 17.63 | ||
| znorm | Inf | ||
| sky | -NaN | -NaN | -Inf |
| S/N | 29.4 | 53.8 | 55.6 |
| S/N(c) | 28.8 | 73.3 | 155.9 |
| SN(E/C) |
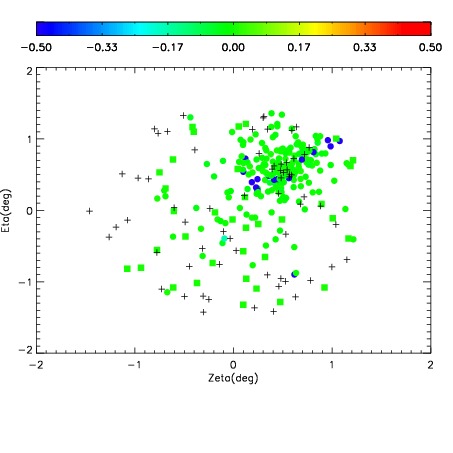
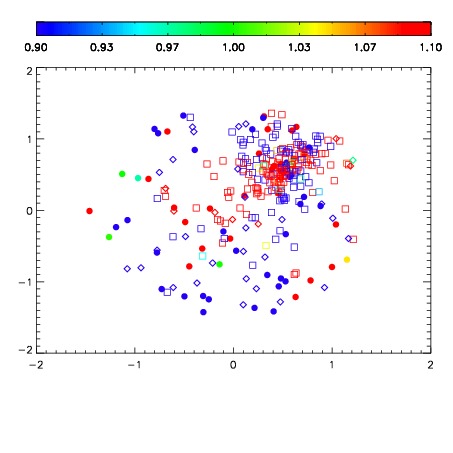
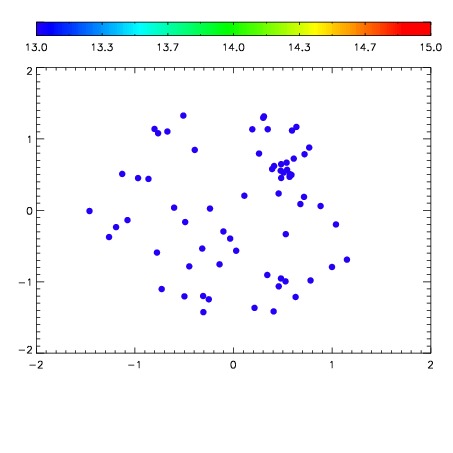

| Frame | Nreads | Zeropoints | Mag plots | Spatial mag deviation | Spatial sky 16325A emission deviations (filled: sky, open: star) | Spatial sky continuum emission | Spatial sky telluric CO2 absorption deviations (filled: H < 10) | |||||||||||||||||||||||
| 0 | 0 |
|
|
|
|
|
|
| IPAIR | NAME | SHIFT | NEWSHIFT | S/N | NAME | SHIFT | NEWSHIFT | S/N |
| 0 | 03410029 | 0.506032 | 0.00000 | 18.5401 | 03410040 | 0.00258770 | 0.503444 | 18.4506 |
| 1 | 03410028 | 0.500186 | 0.00584596 | 18.5643 | 03410023 | 0.00000 | 0.506032 | 18.5690 |
| 2 | 03410025 | 0.504316 | 0.00171602 | 18.5641 | 03410041 | 0.00247261 | 0.503559 | 18.4564 |
| 3 | 03410024 | 0.501921 | 0.00411099 | 18.5037 | 03410037 | 0.00139210 | 0.504640 | 18.4262 |
| 4 | 03410039 | 0.501964 | 0.00406802 | 18.4690 | 03410026 | 0.00285959 | 0.503172 | 18.4248 |
| 5 | 03410042 | 0.499662 | 0.00636998 | 18.4530 | 03410030 | 0.00352138 | 0.502511 | 18.3763 |
| 6 | 03410038 | 0.501337 | 0.00469500 | 18.4160 | 03410044 | 0.00251865 | 0.503513 | 18.3100 |
| 7 | 03410043 | 0.503296 | 0.00273597 | 18.3803 | 03410027 | 0.00174711 | 0.504285 | 18.2013 |