| Red | Green | Blue | |
| z | 17.61 | ||
| znorm | Inf | ||
| sky | -NaN | -NaN | -NaN |
| S/N | 29.9 | 53.6 | 54.1 |
| S/N(c) | 19.5 | 69.0 | 49.9 |
| SN(E/C) |
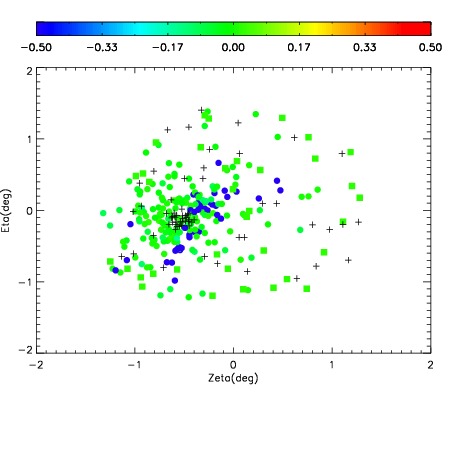
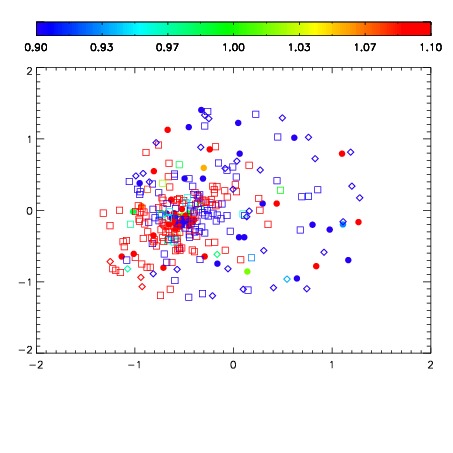
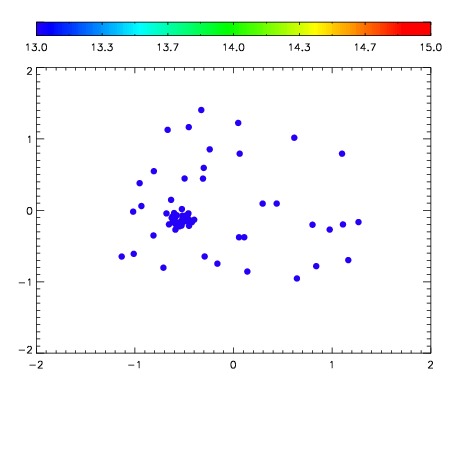

| Frame | Nreads | Zeropoints | Mag plots | Spatial mag deviation | Spatial sky 16325A emission deviations (filled: sky, open: star) | Spatial sky continuum emission | Spatial sky telluric CO2 absorption deviations (filled: H < 10) | |||||||||||||||||||||||
| 0 | 0 |
|
|
|
|
|
|
| IPAIR | NAME | SHIFT | NEWSHIFT | S/N | NAME | SHIFT | NEWSHIFT | S/N |
| 0 | 03060050 | 0.495565 | 0.00000 | 18.3602 | 03060051 | 0.00123149 | 0.494334 | 18.3450 |
| 1 | 03060037 | 0.495080 | 0.000485003 | 18.5362 | 03060036 | 0.00000 | 0.495565 | 18.5249 |
| 2 | 03060041 | 0.492852 | 0.00271299 | 18.4726 | 03060044 | -0.00155715 | 0.497122 | 18.4875 |
| 3 | 03060042 | 0.493718 | 0.00184700 | 18.4626 | 03060048 | -0.000329992 | 0.495895 | 18.4449 |
| 4 | 03060049 | 0.494700 | 0.000864983 | 18.4576 | 03060043 | -0.00122106 | 0.496786 | 18.4363 |
| 5 | 03060045 | 0.493235 | 0.00233001 | 18.4545 | 03060040 | -0.00430263 | 0.499868 | 18.4071 |
| 6 | 03060046 | 0.494535 | 0.00103000 | 18.4274 | 03060039 | -0.00332912 | 0.498894 | 18.4043 |
| 7 | 03060038 | 0.495398 | 0.000166982 | 18.3941 | 03060047 | -0.000275564 | 0.495841 | 18.4026 |