| Red | Green | Blue | |
| z | 17.63 | ||
| znorm | Inf | ||
| sky | -NaN | -NaN | -NaN |
| S/N | 22.0 | 38.9 | 40.2 |
| S/N(c) | 28.2 | 52.7 | 29.3 |
| SN(E/C) |
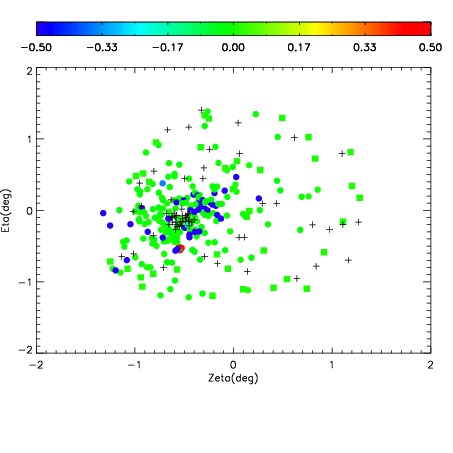
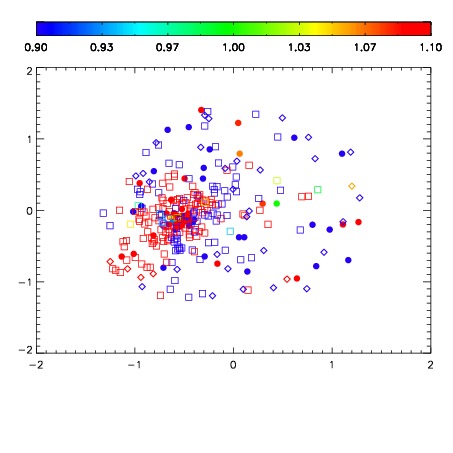
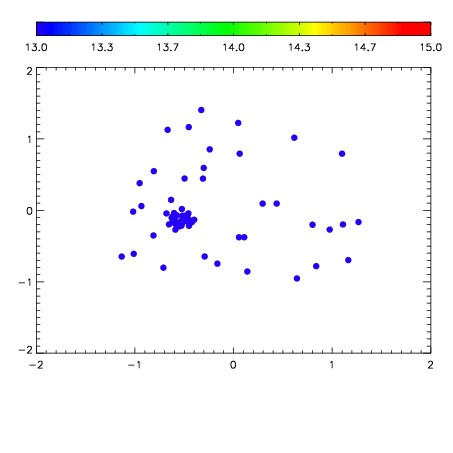

| Frame | Nreads | Zeropoints | Mag plots | Spatial mag deviation | Spatial sky 16325A emission deviations (filled: sky, open: star) | Spatial sky continuum emission | Spatial sky telluric CO2 absorption deviations (filled: H < 10) | |||||||||||||||||||||||
| 0 | 0 |
|
|
|
|
|
|
| IPAIR | NAME | SHIFT | NEWSHIFT | S/N | NAME | SHIFT | NEWSHIFT | S/N |
| 0 | 03190029 | 0.503052 | 0.00000 | 18.4898 | 03190027 | 0.00280514 | 0.500247 | 18.4993 |
| 1 | 03190025 | 0.499766 | 0.00328600 | 18.5350 | 03190023 | 0.00000 | 0.503052 | 18.5324 |
| 2 | 03190024 | 0.497679 | 0.00537300 | 18.4917 | 03190026 | 0.00146095 | 0.501591 | 18.5292 |
| 3 | 03190028 | 0.499713 | 0.00333899 | 18.4287 | 03190030 | 0.00299247 | 0.500060 | 18.4956 |