| Red | Green | Blue | |
| z | 17.62 | ||
| znorm | Inf | ||
| sky | -NaN | -NaN | -NaN |
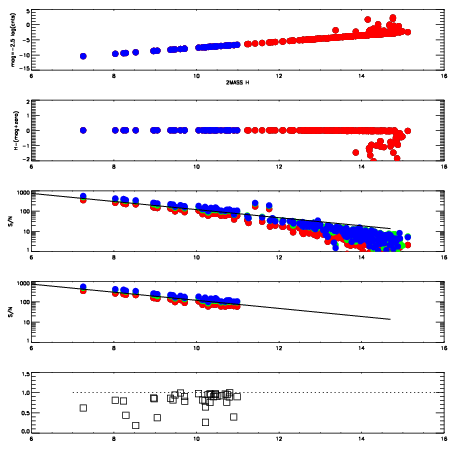
| S/N | 20.9 | 37.8 | 39.2 |
| S/N(c) | 27.4 | 50.7 | 28.2 |
| SN(E/C) |
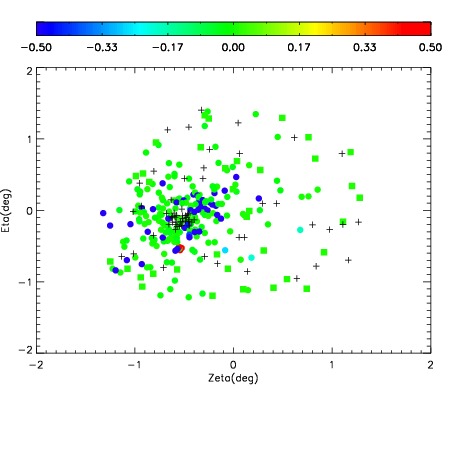
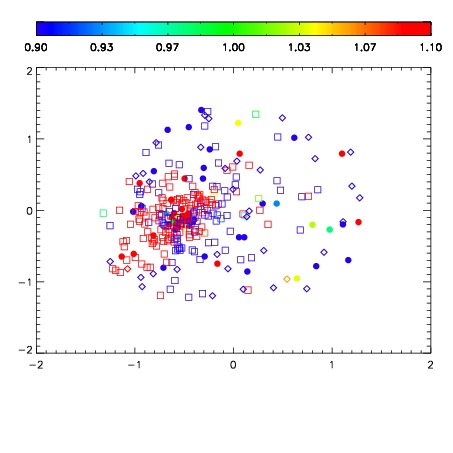
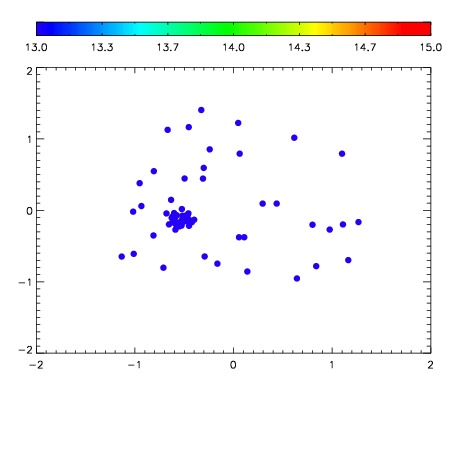

| Frame | Nreads | Zeropoints | Mag plots | Spatial mag deviation | Spatial sky 16325A emission deviations (filled: sky, open: star) | Spatial sky continuum emission | Spatial sky telluric CO2 absorption deviations (filled: H < 10) | |||||||||||||||||||||||
| 0 | 0 |
|
|
|
|
|
|
| IPAIR | NAME | SHIFT | NEWSHIFT | S/N | NAME | SHIFT | NEWSHIFT | S/N |
| 0 | 03200016 | 0.517083 | 0.00000 | 18.4641 | 03200017 | 0.00224734 | 0.514836 | 18.4513 |
| 1 | 03200015 | 0.507629 | 0.00945401 | 18.4503 | 03200013 | 0.00149719 | 0.515586 | 18.4451 |
| 2 | 03200011 | 0.507968 | 0.00911498 | 18.3743 | 03200014 | 0.00187738 | 0.515206 | 18.4063 |
| 3 | 03200012 | 0.507838 | 0.00924498 | 18.3188 | 03200010 | 0.00000 | 0.517083 | 18.2204 |