| Red | Green | Blue | |
| z | 17.62 | ||
| znorm | Inf | ||
| sky | -NaN | -NaN | -NaN |
| S/N | 24.9 | 45.0 | 46.8 |
| S/N(c) | 33.6 | 62.8 | 35.1 |
| SN(E/C) |
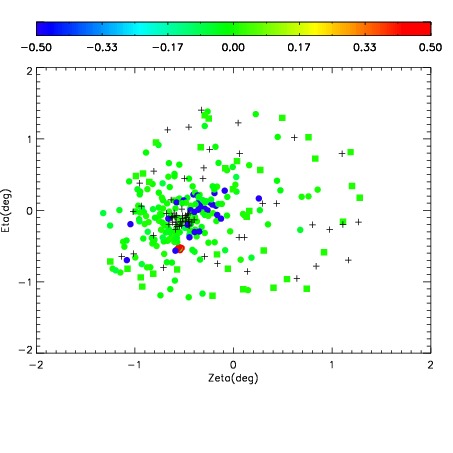
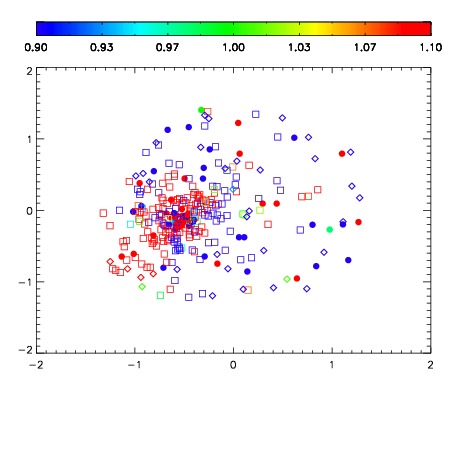


| Frame | Nreads | Zeropoints | Mag plots | Spatial mag deviation | Spatial sky 16325A emission deviations (filled: sky, open: star) | Spatial sky continuum emission | Spatial sky telluric CO2 absorption deviations (filled: H < 10) | |||||||||||||||||||||||
| 0 | 0 |
|
|
|
|
|
|
| IPAIR | NAME | SHIFT | NEWSHIFT | S/N | NAME | SHIFT | NEWSHIFT | S/N |
| 0 | 03210012 | 0.514942 | 0.00000 | 18.5016 | 03210013 | 0.000359283 | 0.514583 | 18.4737 |
| 1 | 03210015 | 0.504676 | 0.0102660 | 18.5029 | 03210014 | 0.00123224 | 0.513710 | 18.4983 |
| 2 | 03210011 | 0.507536 | 0.00740600 | 18.4843 | 03210017 | 0.00191483 | 0.513027 | 18.4681 |
| 3 | 03210016 | 0.505558 | 0.00938398 | 18.4702 | 03210010 | 0.00000 | 0.514942 | 18.4519 |
| 4 | 03210020 | 0.514761 | 0.000181019 | 18.3867 | 03210021 | 0.00130211 | 0.513640 | 18.3827 |
| 5 | 03210019 | 0.507909 | 0.00703299 | 18.0963 | 03210018 | 0.000780315 | 0.514162 | 18.1918 |