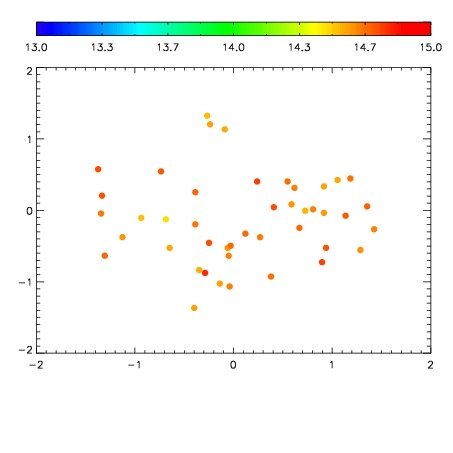
| Frame | Nreads | Zeropoints | Mag plots
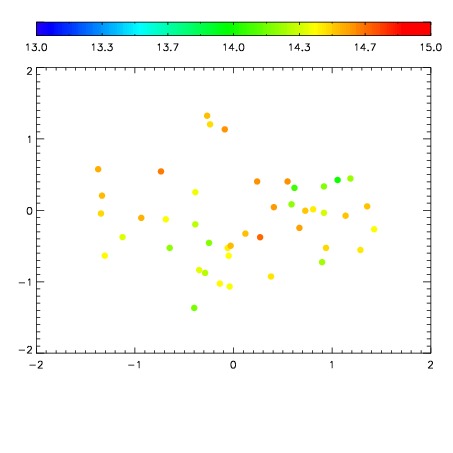
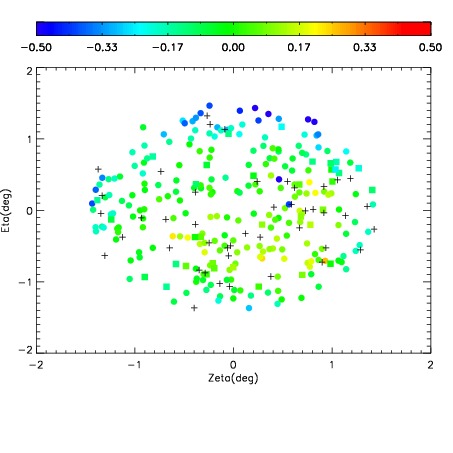
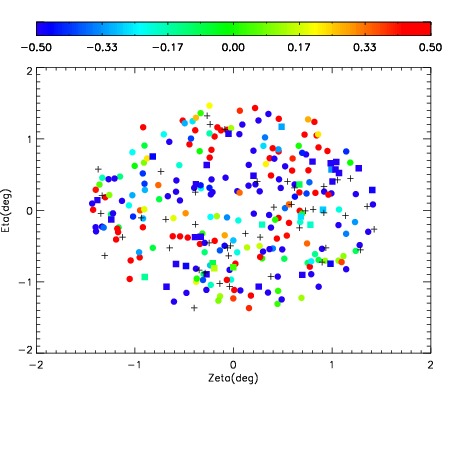
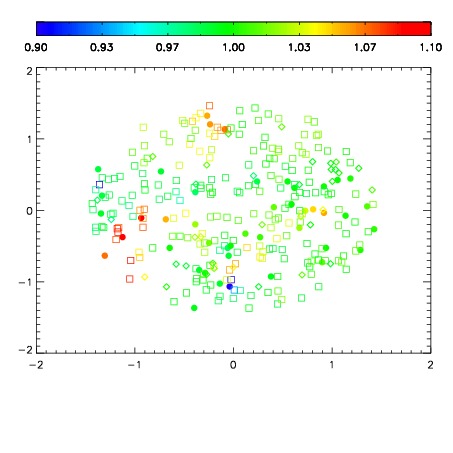
| Spatial mag deviation
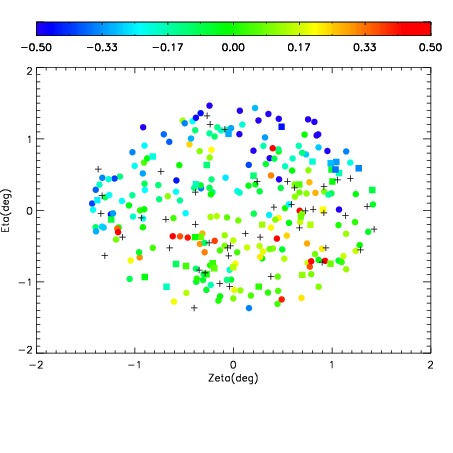
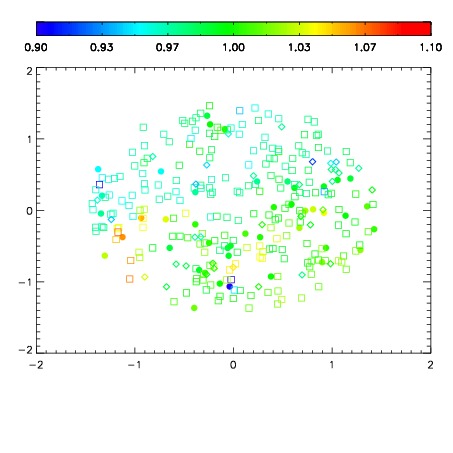
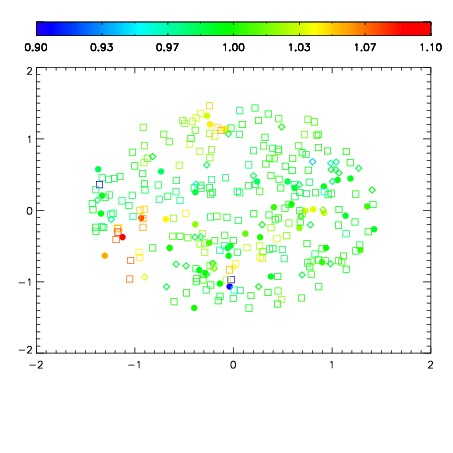
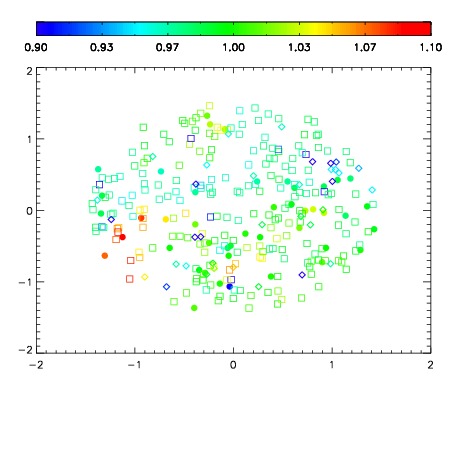
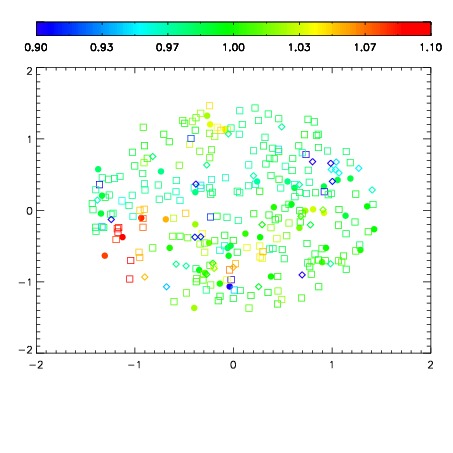
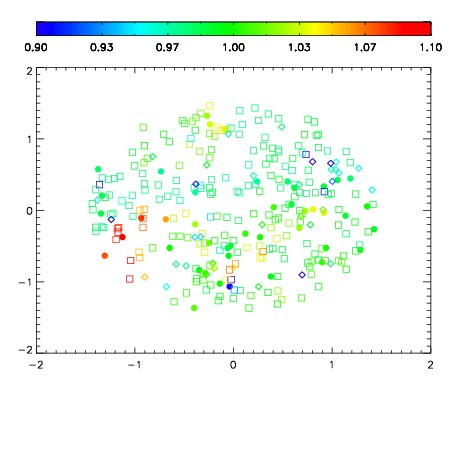
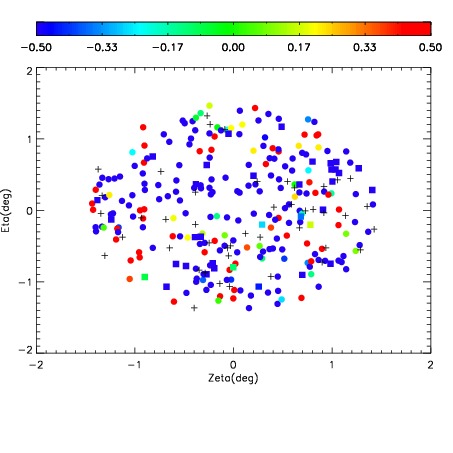
| Spatial sky 16325A emission deviations (filled: sky, open: star)
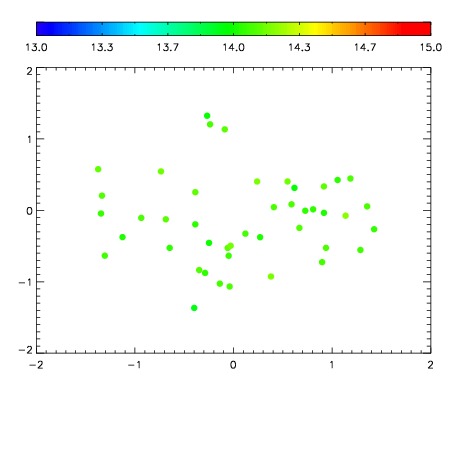
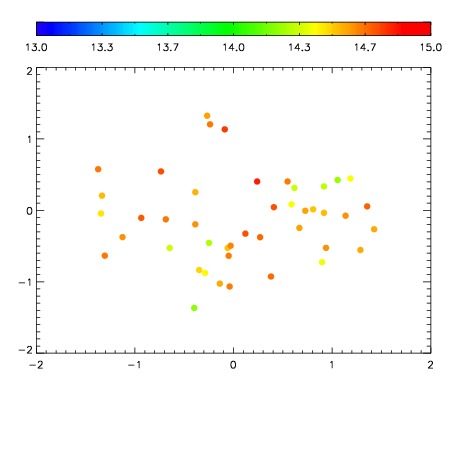
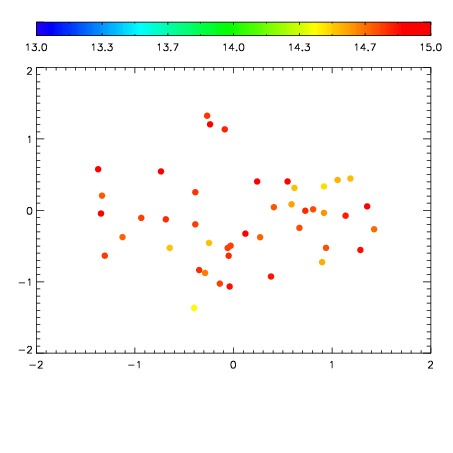
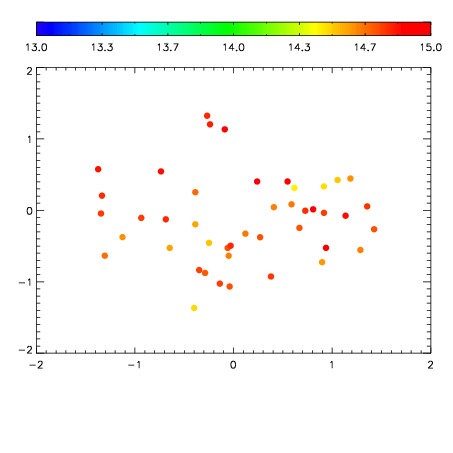
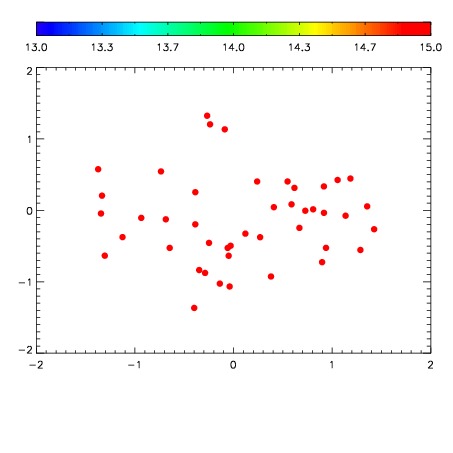
| Spatial sky continuum emission
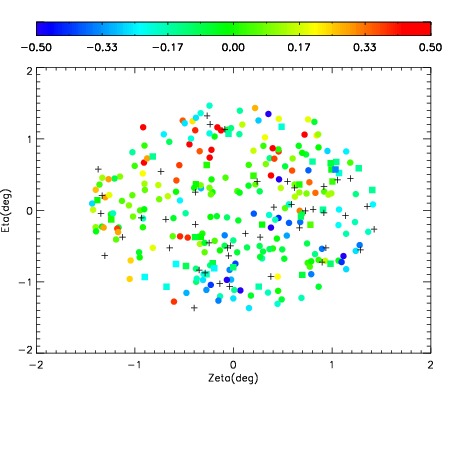
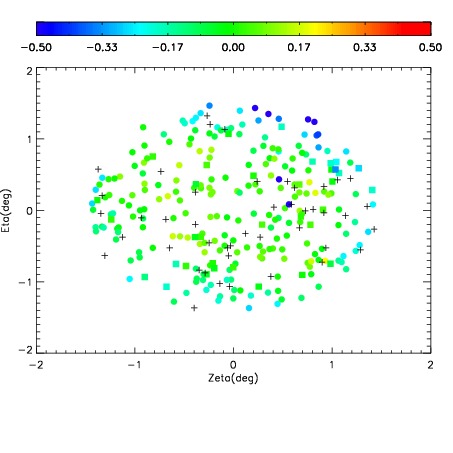
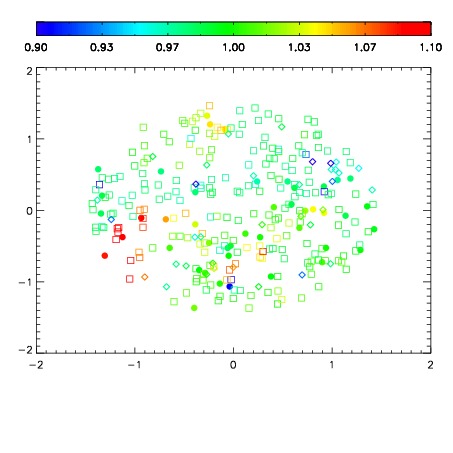
| Spatial sky telluric CO2 absorption deviations (filled: H < 10)
|
| 3120095
| 47
| | Red | Green | Blue
| | z | | 16.30
| | znorm | | 12.12
| | sky | 14.2 | 14.1 | 13.9
| | S/N | 1.8 | 4.3 | 4.6
| | S/N(c) | 5.3 | 6.6 | 7.7
| | SN(E/C) 1.04
|
| 
| 
| 
| 
| 
|
| 3120096
| 47
| | Red | Green | Blue
| | z | | 15.88
| | znorm | | 11.70
| | sky | 13.9 | 13.9 | 14.0
| | S/N | 0.9 | 2.3 | 3.8
| | S/N(c) | 3.7 | 4.5 | 5.9
| | SN(E/C) 1.08
|
| 
| 
| 
| 
| 
|
| 3120097
| 47
| | Red | Green | Blue
| | z | | 18.54
| | znorm | | 14.36
| | sky | 14.3 | 14.4 | 14.3
| | S/N | 11.5 | 18.9 | 18.4
| | S/N(c) | 26.0 | 24.6 | 29.7
| | SN(E/C) 0.90
|
| 
| 
| 
| 
| 
|
| 3120098
| 47
| | Red | Green | Blue
| | z | | 18.37
| | znorm | | 14.19
| | sky | 14.8 | 14.6 | 14.4
| | S/N | 10.4 | 17.5 | 17.5
| | S/N(c) | 23.7 | 22.5 | 26.8
| | SN(E/C) 0.92
|
| 
| 
| 
| 
| 
|
| 3120099
| 47
| | Red | Green | Blue
| | z | | 17.94
| | znorm | | 13.76
| | sky | 14.8 | 14.8 | 14.8
| | S/N | 7.1 | 13.3 | 13.5
| | S/N(c) | 17.7 | 18.0 | 21.3
| | SN(E/C) 0.96
|
| 
| 
| 
| 
| 
|
| 3120100
| 47
| | Red | Green | Blue
| | z | | 17.74
| | znorm | | 13.56
| | sky | 14.9 | 14.7 | 14.7
| | S/N | 6.1 | 11.8 | 12.3
| | S/N(c) | 16.3 | 16.1 | 19.8
| | SN(E/C) 0.95
|
| 
| 
| 
| 
| 
|
| 3120101
| 47
| | Red | Green | Blue
| | z | | 14.22
| | znorm | | 10.04
| | sky | 14.7 | 14.6 | 14.8
| | S/N | 0.1 | 0.8 | 3.8
| | S/N(c) | 0.5 | 1.1 | 2.1
| | SN(E/C) 0.97
|
| 
| 
| 
| 
| 
|
| 3120102
| 47
| | Red | Green | Blue
| | z | | 13.35
| | znorm | | 9.17
| | sky | 14.7 | 15.1 | 15.2
| | S/N | -0.0 | 0.4 | 3.3
| | S/N(c) | 0.0 | 0.0 | 0.0
| | SN(E/C) 1.59
|
| 
| 
| 
| 
| 
|