| Red | Green | Blue | |
| z | 17.64 | ||
| znorm | Inf | ||
| sky | -Inf | -NaN | -Inf |
| S/N | 10.7 | 19.8 | 21.5 |
| S/N(c) | 0.0 | 0.0 | 0.0 |
| SN(E/C) |
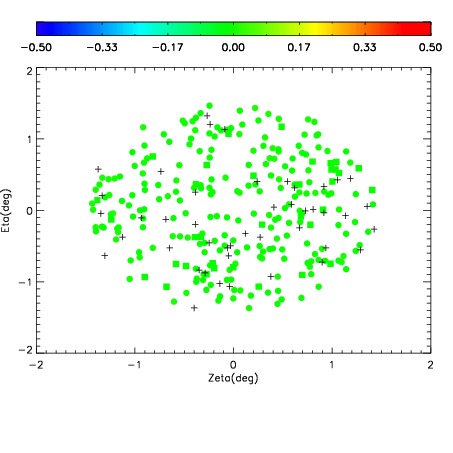
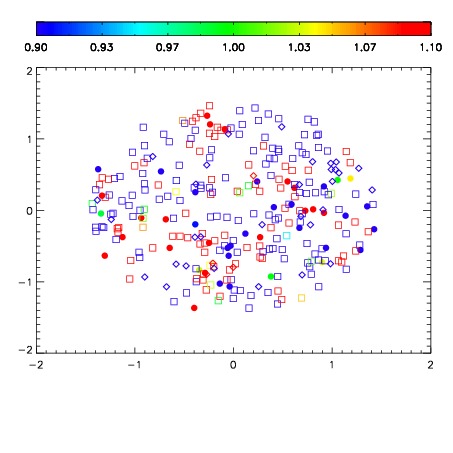


| Frame | Nreads | Zeropoints | Mag plots | Spatial mag deviation | Spatial sky 16325A emission deviations (filled: sky, open: star) | Spatial sky continuum emission | Spatial sky telluric CO2 absorption deviations (filled: H < 10) | |||||||||||||||||||||||
| 0 | 0 |
|
|
|
|
|
|
| IPAIR | NAME | SHIFT | NEWSHIFT | S/N | NAME | SHIFT | NEWSHIFT | S/N |
| 0 | 03120100 | 0.486852 | 0.00000 | 17.7143 | 03120099 | -0.00174962 | 0.488602 | 17.9149 |
| 1 | 03120097 | 0.483351 | 0.00350100 | 18.5229 | 03120098 | -0.00130181 | 0.488154 | 18.3526 |
| 2 | 03120096 | 0.483465 | 0.00338700 | 15.8670 | 03120095 | 0.00000 | 0.486852 | 16.2813 |