| Red | Green | Blue | |
| z | 17.64 | ||
| znorm | Inf | ||
| sky | -Inf | -Inf | -Inf |
| S/N | 29.6 | 49.9 | 51.3 |
| S/N(c) | 0.0 | 0.0 | 0.0 |
| SN(E/C) |
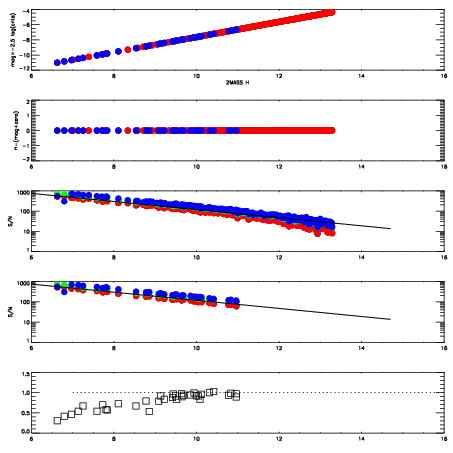
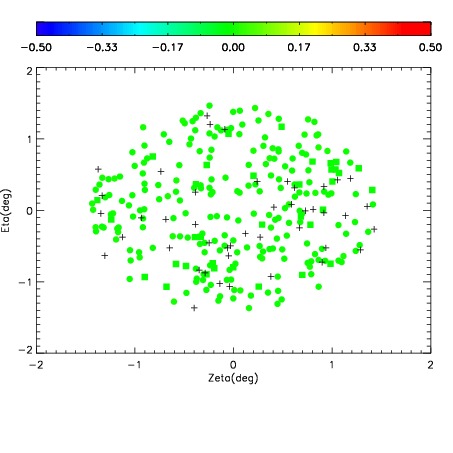
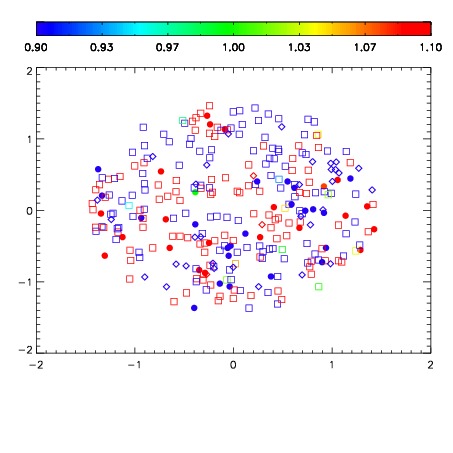
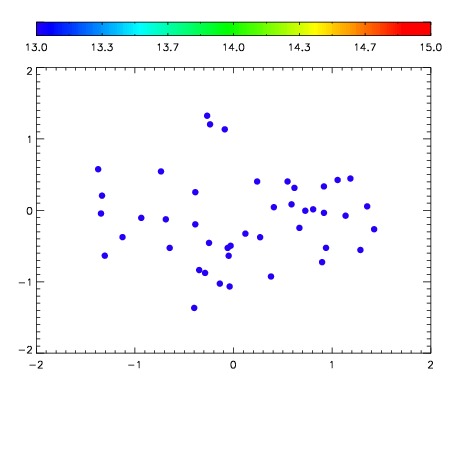

| Frame | Nreads | Zeropoints | Mag plots | Spatial mag deviation | Spatial sky 16325A emission deviations (filled: sky, open: star) | Spatial sky continuum emission | Spatial sky telluric CO2 absorption deviations (filled: H < 10) | |||||||||||||||||||||||
| 0 | 0 |
|
|
|
|
|
|
| IPAIR | NAME | SHIFT | NEWSHIFT | S/N | NAME | SHIFT | NEWSHIFT | S/N |
| 0 | 03410087 | 0.499554 | 0.00000 | 19.1895 | 03410088 | -0.000434572 | 0.499989 | 19.1846 |
| 1 | 03410086 | 0.498804 | 0.000750005 | 19.2156 | 03410084 | -0.00100712 | 0.500561 | 19.2359 |
| 2 | 03410083 | 0.491684 | 0.00787002 | 19.1948 | 03410085 | -0.00157935 | 0.501133 | 19.2318 |
| 3 | 03410082 | 0.490590 | 0.00896400 | 19.1695 | 03410081 | 0.00000 | 0.499554 | 19.1840 |