| Red | Green | Blue | |
| z | 17.64 | ||
| znorm | Inf | ||
| sky | -Inf | -Inf | -Inf |
| S/N | 4.9 | 9.2 | 9.9 |
| S/N(c) | 0.0 | 0.0 | 0.0 |
| SN(E/C) |
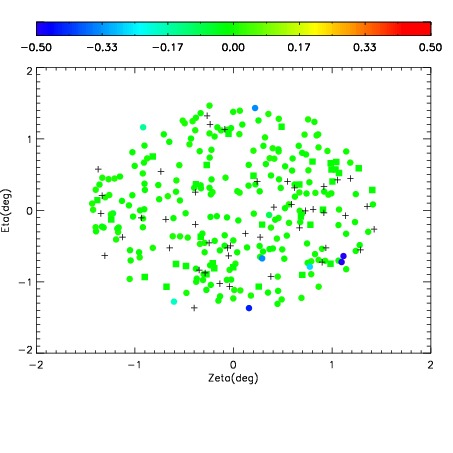
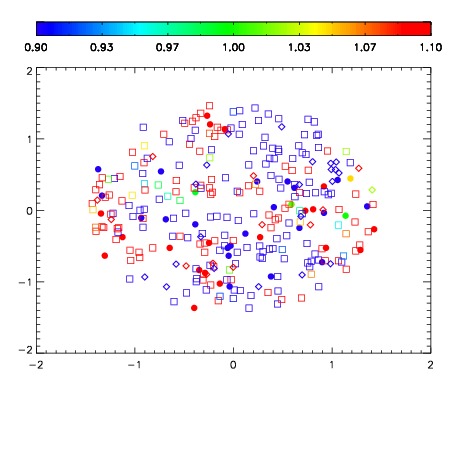
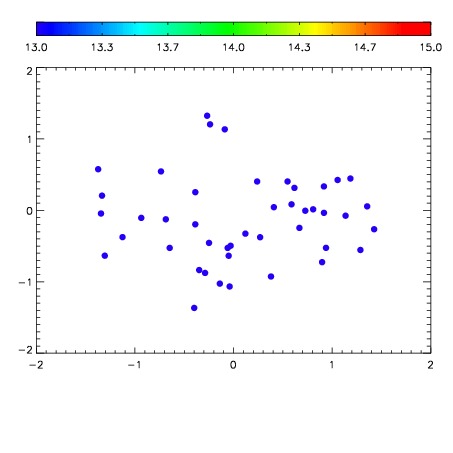

| Frame | Nreads | Zeropoints | Mag plots | Spatial mag deviation | Spatial sky 16325A emission deviations (filled: sky, open: star) | Spatial sky continuum emission | Spatial sky telluric CO2 absorption deviations (filled: H < 10) | |||||||||||||||||||||||
| 0 | 0 |
|
|
|
|
|
|
| IPAIR | NAME | SHIFT | NEWSHIFT | S/N | NAME | SHIFT | NEWSHIFT | S/N |
| 0 | 03500030 | 0.512601 | 0.00000 | 17.3092 | 03500027 | 0.00245897 | 0.510142 | 17.3127 |
| 1 | 03500029 | 0.508540 | 0.00406104 | 16.3355 | 03500028 | 0.00234934 | 0.510252 | 17.0481 |
| 2 | 03500026 | 0.507781 | 0.00481999 | 15.2345 | 03500024 | 0.00000 | 0.512601 | 16.9015 |
| 3 | 03500025 | 0.506647 | 0.00595403 | 14.9159 | 03500031 | 0.00324802 | 0.509353 | 16.7100 |