| Red | Green | Blue | |
| z | 17.64 | ||
| znorm | Inf | ||
| sky | -Inf | -Inf | -Inf |
| S/N | 33.2 | 48.3 | 52.6 |
| S/N(c) | 0.0 | 0.0 | 0.0 |
| SN(E/C) |
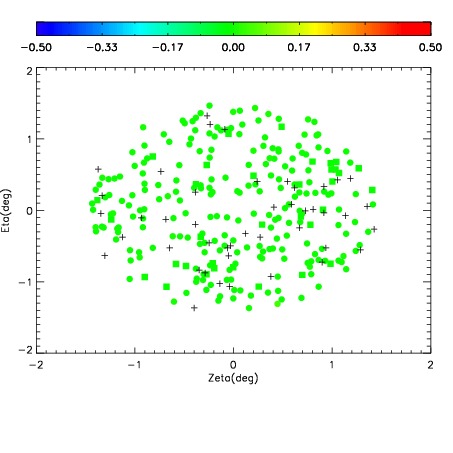
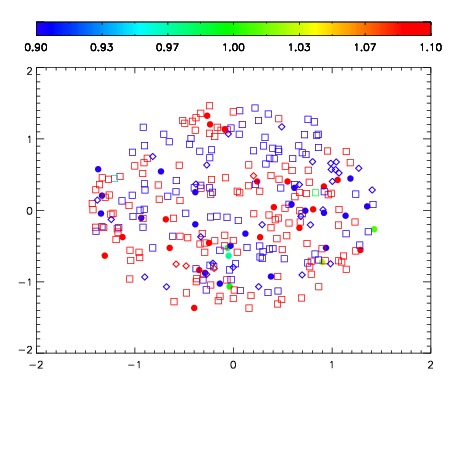


| Frame | Nreads | Zeropoints | Mag plots | Spatial mag deviation | Spatial sky 16325A emission deviations (filled: sky, open: star) | Spatial sky continuum emission | Spatial sky telluric CO2 absorption deviations (filled: H < 10) | |||||||||||||||||||||||
| 0 | 0 |
|
|
|
|
|
|
| IPAIR | NAME | SHIFT | NEWSHIFT | S/N | NAME | SHIFT | NEWSHIFT | S/N |
| 0 | 03670076 | 0.508099 | 0.00000 | 19.2871 | 03670070 | 0.00000 | 0.508099 | 19.2940 |
| 1 | 03670075 | 0.505973 | 0.00212604 | 19.3024 | 03670074 | 0.00262130 | 0.505478 | 19.3080 |
| 2 | 03670072 | 0.497155 | 0.0109440 | 19.3024 | 03670077 | 0.00324622 | 0.504853 | 19.3061 |
| 3 | 03670071 | 0.495780 | 0.0123190 | 19.2933 | 03670073 | 0.00329394 | 0.504805 | 19.3053 |