| Red | Green | Blue | |
| z | 17.64 | ||
| znorm | Inf | ||
| sky | -NaN | -NaN | -Inf |
| S/N | 28.7 | 48.2 | 49.1 |
| S/N(c) | 0.0 | 0.0 | 0.0 |
| SN(E/C) |
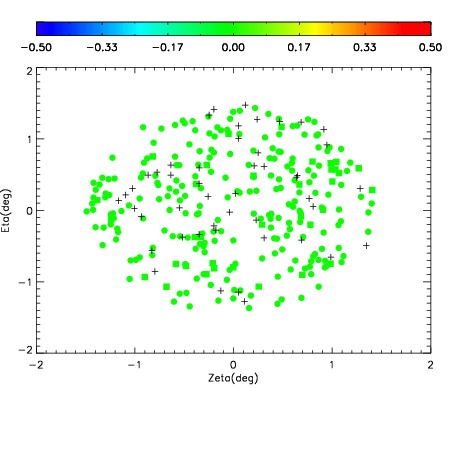
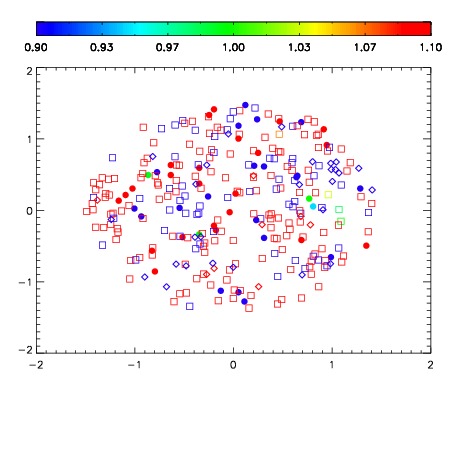
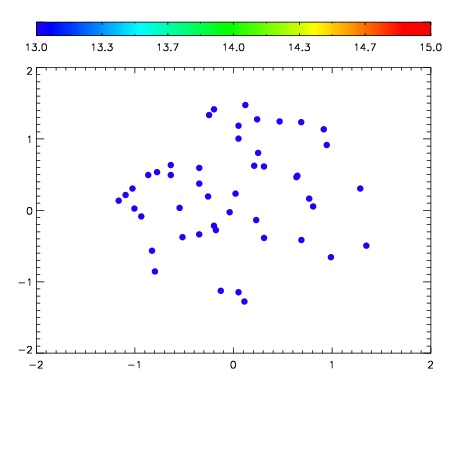

| Frame | Nreads | Zeropoints | Mag plots | Spatial mag deviation | Spatial sky 16325A emission deviations (filled: sky, open: star) | Spatial sky continuum emission | Spatial sky telluric CO2 absorption deviations (filled: H < 10) | |||||||||||||||||||||||
| 0 | 0 |
|
|
|
|
|
|
| IPAIR | NAME | SHIFT | NEWSHIFT | S/N | NAME | SHIFT | NEWSHIFT | S/N |
| 0 | 03200060 | 0.515538 | 0.00000 | 19.1677 | 03200058 | 0.00000 | 0.515538 | 19.1560 |
| 1 | 03200059 | 0.509052 | 0.00648600 | 19.1804 | 03200061 | -0.00127617 | 0.516814 | 19.1774 |
| 2 | 03200063 | 0.504782 | 0.0107560 | 19.1319 | 03200062 | -0.00251431 | 0.518052 | 19.1538 |
| 3 | 03200064 | 0.513633 | 0.00190496 | 19.1160 | 03200065 | -0.00160016 | 0.517138 | 19.0970 |