| Red | Green | Blue | |
| z | 17.64 | ||
| znorm | Inf | ||
| sky | -NaN | -NaN | -NaN |
| S/N | 22.7 | 41.9 | 41.2 |
| S/N(c) | 0.0 | 0.0 | 0.0 |
| SN(E/C) |
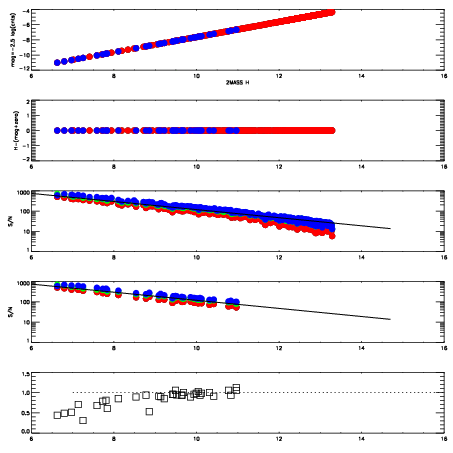
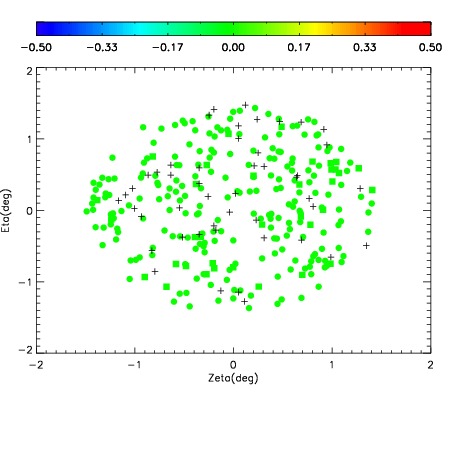
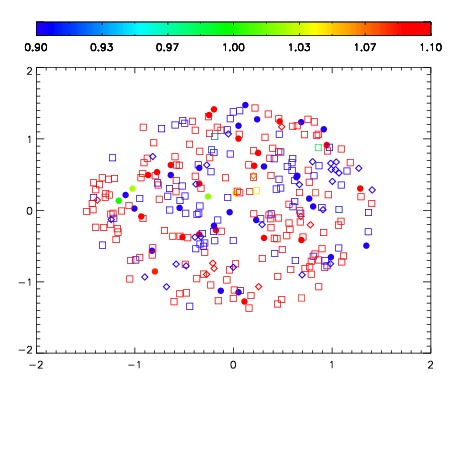
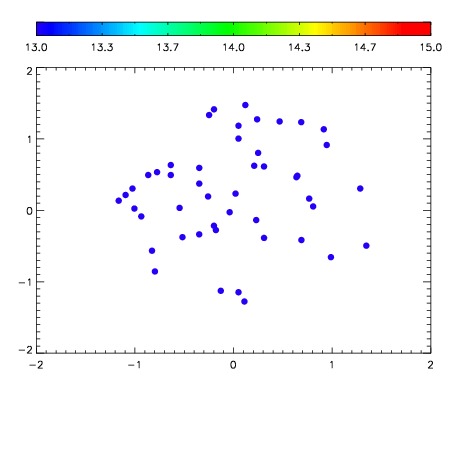

| Frame | Nreads | Zeropoints | Mag plots | Spatial mag deviation | Spatial sky 16325A emission deviations (filled: sky, open: star) | Spatial sky continuum emission | Spatial sky telluric CO2 absorption deviations (filled: H < 10) | |||||||||||||||||||||||
| 0 | 0 |
|
|
|
|
|
|
| IPAIR | NAME | SHIFT | NEWSHIFT | S/N | NAME | SHIFT | NEWSHIFT | S/N |
| 0 | 03780031 | 0.505783 | 0.00000 | 19.0017 | 03780025 | 0.00000 | 0.505783 | 18.9464 |
| 1 | 03780027 | 0.504476 | 0.00130701 | 19.0199 | 03780032 | 0.00185199 | 0.503931 | 18.9729 |
| 2 | 03780026 | 0.504661 | 0.00112200 | 19.0066 | 03780028 | 0.00126319 | 0.504520 | 18.9692 |
| 3 | 03780030 | 0.504021 | 0.00176203 | 18.9822 | 03780029 | 0.00218029 | 0.503603 | 18.8064 |