| Red | Green | Blue | |
| z | 17.64 | ||
| znorm | Inf | ||
| sky | -NaN | -NaN | -NaN |
| S/N | 22.1 | 36.8 | 39.4 |
| S/N(c) | 0.0 | 0.0 | 0.0 |
| SN(E/C) |
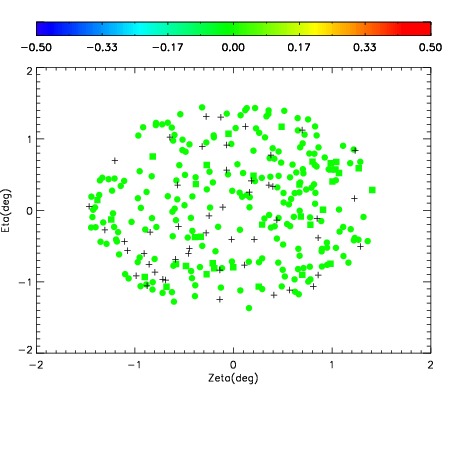
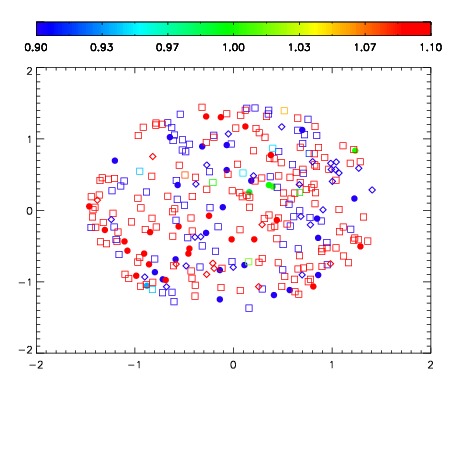
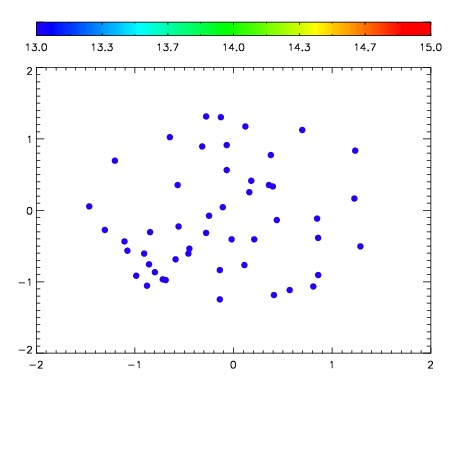

| Frame | Nreads | Zeropoints | Mag plots | Spatial mag deviation | Spatial sky 16325A emission deviations (filled: sky, open: star) | Spatial sky continuum emission | Spatial sky telluric CO2 absorption deviations (filled: H < 10) | |||||||||||||||||||||||
| 0 | 0 |
|
|
|
|
|
|
| IPAIR | NAME | SHIFT | NEWSHIFT | S/N | NAME | SHIFT | NEWSHIFT | S/N |
| 0 | 03970033 | 0.504349 | 0.00000 | 18.9655 | 03970027 | 0.00000 | 0.504349 | 18.8545 |
| 1 | 03970028 | 0.501695 | 0.00265402 | 18.8714 | 03970031 | 0.000687974 | 0.503661 | 18.6766 |
| 2 | 03970032 | 0.503357 | 0.000992000 | 18.7911 | 03970034 | 0.00206451 | 0.502284 | 18.4250 |
| 3 | 03970029 | 0.502956 | 0.00139302 | 18.7906 | 03970030 | 0.00239780 | 0.501951 | 18.0877 |