| Red | Green | Blue | |
| z | 17.64 | ||
| znorm | Inf | ||
| sky | -NaN | -NaN | -Inf |
| S/N | 28.2 | 45.5 | 48.0 |
| S/N(c) | 0.0 | 0.0 | 0.0 |
| SN(E/C) |
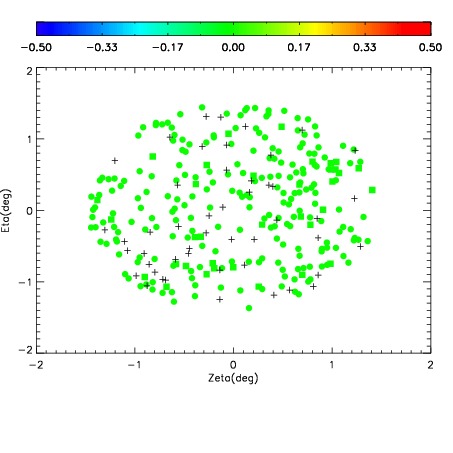
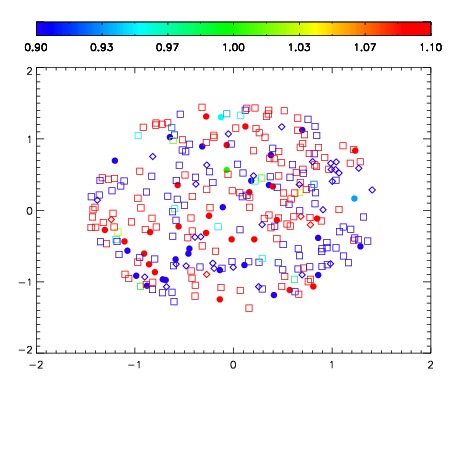


| Frame | Nreads | Zeropoints | Mag plots | Spatial mag deviation | Spatial sky 16325A emission deviations (filled: sky, open: star) | Spatial sky continuum emission | Spatial sky telluric CO2 absorption deviations (filled: H < 10) | |||||||||||||||||||||||
| 0 | 0 |
|
|
|
|
|
|
| IPAIR | NAME | SHIFT | NEWSHIFT | S/N | NAME | SHIFT | NEWSHIFT | S/N |
| 0 | 11340048 | 0.484698 | 0.00000 | 18.8984 | 11340034 | 0.00000 | 0.484698 | 18.9713 |
| 1 | 11340049 | 0.484608 | 9.00030e-05 | 18.8927 | 11340037 | -0.000126746 | 0.484825 | 18.7131 |
| 2 | 11340035 | 0.480729 | 0.00396898 | 18.6954 | 11340038 | 0.000771226 | 0.483927 | 18.3717 |
| 3 | 11340036 | 0.481639 | 0.00305900 | 18.6841 | 11340047 | 0.00322263 | 0.481475 | 18.3504 |
| 4 | 11340039 | 0.482007 | 0.00269100 | 18.1294 | 11340050 | 0.00194689 | 0.482751 | 18.2666 |
| 5 | 11340040 | 0.483663 | 0.00103500 | 17.8951 | 11340041 | 0.00245123 | 0.482247 | 18.2633 |