| Red | Green | Blue | |
| z | 17.64 | ||
| znorm | Inf | ||
| sky | -Inf | -Inf | -Inf |
| S/N | 18.9 | 31.9 | 32.5 |
| S/N(c) | 0.0 | 0.0 | 0.0 |
| SN(E/C) |
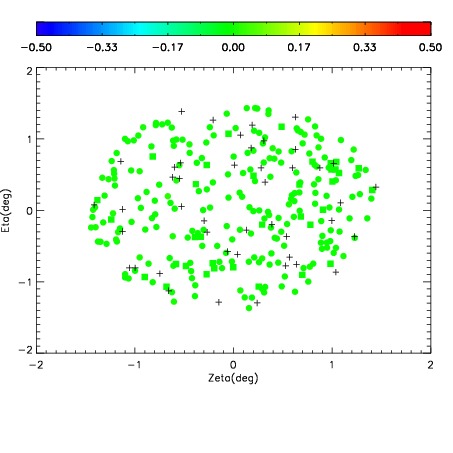
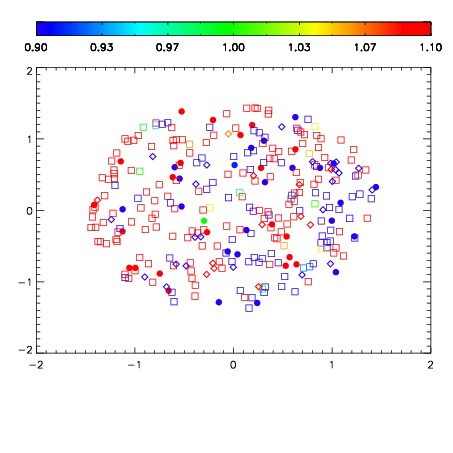
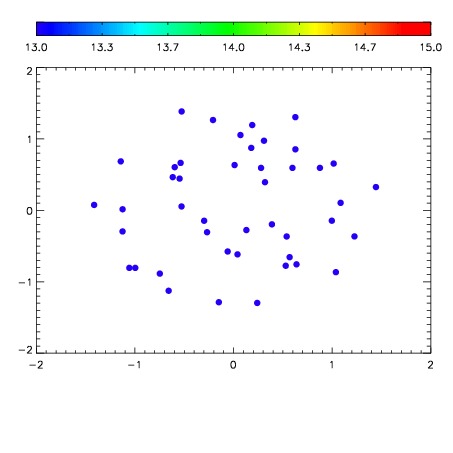

| Frame | Nreads | Zeropoints | Mag plots | Spatial mag deviation | Spatial sky 16325A emission deviations (filled: sky, open: star) | Spatial sky continuum emission | Spatial sky telluric CO2 absorption deviations (filled: H < 10) | |||||||||||||||||||||||
| 0 | 0 |
|
|
|
|
|
|
| IPAIR | NAME | SHIFT | NEWSHIFT | S/N | NAME | SHIFT | NEWSHIFT | S/N |
| 0 | 03100082 | 0.503023 | 0.00000 | 18.2965 | 03100083 | 0.00437241 | 0.498651 | 18.5080 |
| 1 | 03100077 | 0.500355 | 0.00266802 | 18.4774 | 03100079 | 0.00677743 | 0.496246 | 18.5519 |
| 2 | 03100081 | 0.501991 | 0.00103205 | 18.3659 | 03100080 | 0.00632111 | 0.496702 | 18.5427 |
| 3 | 03100078 | 0.500944 | 0.00207901 | 17.3919 | 03100076 | 0.00000 | 0.503023 | 18.3901 |