| Red | Green | Blue | |
| z | 17.63 | ||
| znorm | Inf | ||
| sky | -NaN | -NaN | -Inf |
| S/N | 35.7 | 58.8 | 65.2 |
| S/N(c) | 0.0 | 0.0 | 0.0 |
| SN(E/C) |

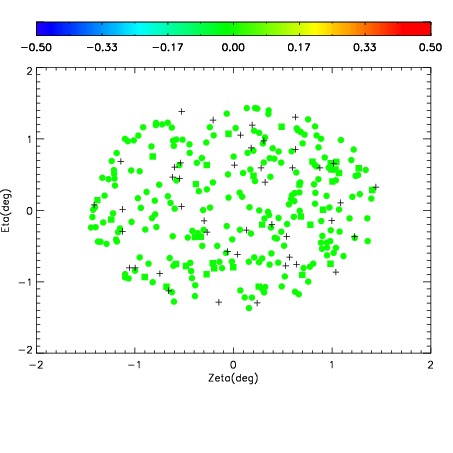
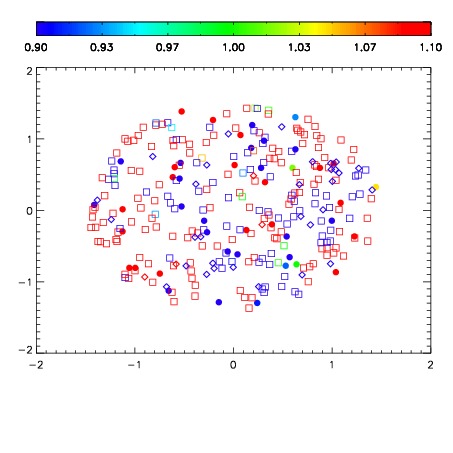


| Frame | Nreads | Zeropoints | Mag plots | Spatial mag deviation | Spatial sky 16325A emission deviations (filled: sky, open: star) | Spatial sky continuum emission | Spatial sky telluric CO2 absorption deviations (filled: H < 10) | |||||||||||||||||||||||
| 0 | 0 |
|
|
|
|
|
|
| IPAIR | NAME | SHIFT | NEWSHIFT | S/N | NAME | SHIFT | NEWSHIFT | S/N |
| 0 | 04030042 | 0.510017 | 0.00000 | 19.1933 | 04030040 | -0.00120424 | 0.511221 | 19.2083 |
| 1 | 04030038 | 0.495823 | 0.0141940 | 19.1843 | 04030043 | -0.000165752 | 0.510183 | 19.1492 |
| 2 | 04030037 | 0.495465 | 0.0145520 | 19.1793 | 04030047 | 0.00437317 | 0.505644 | 19.1386 |
| 3 | 04030041 | 0.502295 | 0.00772196 | 19.1618 | 04030039 | -0.000655092 | 0.510672 | 19.1349 |
| 4 | 04030046 | 0.507690 | 0.00232697 | 19.1592 | 04030036 | 0.00000 | 0.510017 | 19.1303 |
| 5 | 04030045 | 0.506309 | 0.00370800 | 19.1361 | 04030044 | -0.000513796 | 0.510531 | 19.0788 |