| Red | Green | Blue | |
| z | 17.64 | ||
| znorm | Inf | ||
| sky | -Inf | -NaN | -Inf |
| S/N | 28.2 | 47.4 | 49.9 |
| S/N(c) | 0.0 | 0.0 | 0.0 |
| SN(E/C) |
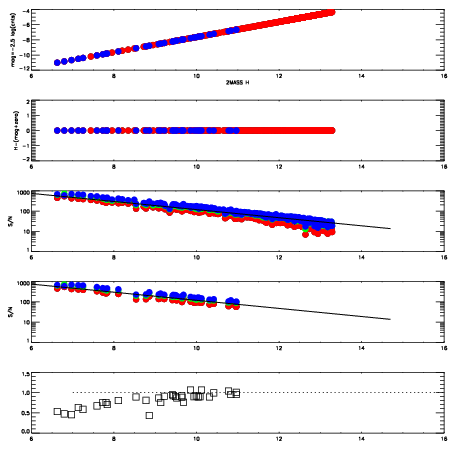
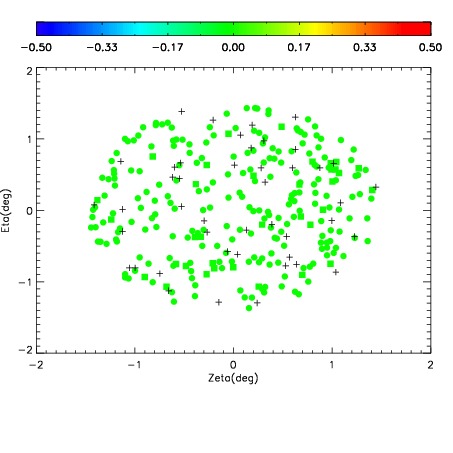
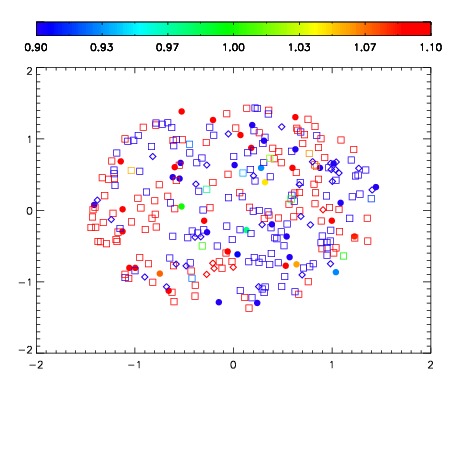
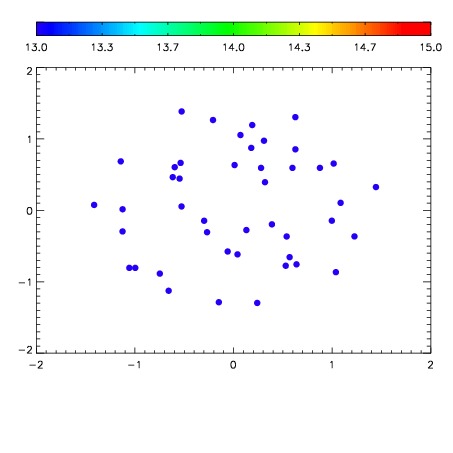

| Frame | Nreads | Zeropoints | Mag plots | Spatial mag deviation | Spatial sky 16325A emission deviations (filled: sky, open: star) | Spatial sky continuum emission | Spatial sky telluric CO2 absorption deviations (filled: H < 10) | |||||||||||||||||||||||
| 0 | 0 |
|
|
|
|
|
|
| IPAIR | NAME | SHIFT | NEWSHIFT | S/N | NAME | SHIFT | NEWSHIFT | S/N |
| 0 | 11140056 | 0.489963 | 0.00000 | 19.0576 | 11140050 | 0.00000 | 0.489963 | 18.9656 |
| 1 | 11140055 | 0.488937 | 0.00102600 | 19.1348 | 11140053 | 0.00135654 | 0.488606 | 19.1312 |
| 2 | 11140052 | 0.485843 | 0.00411999 | 19.0995 | 11140054 | 0.00142374 | 0.488539 | 19.1162 |
| 3 | 11140051 | 0.485239 | 0.00472400 | 19.0905 | 11140057 | 0.00283112 | 0.487132 | 19.0926 |