| Red | Green | Blue | |
| z | 17.64 | ||
| znorm | Inf | ||
| sky | -Inf | -Inf | -Inf |
| S/N | 9.1 | 16.7 | 20.2 |
| S/N(c) | 0.0 | 0.0 | 0.0 |
| SN(E/C) |
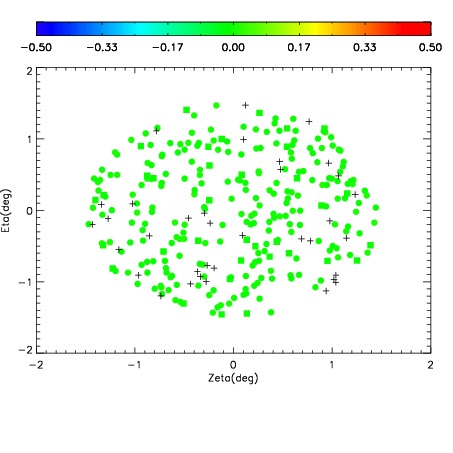
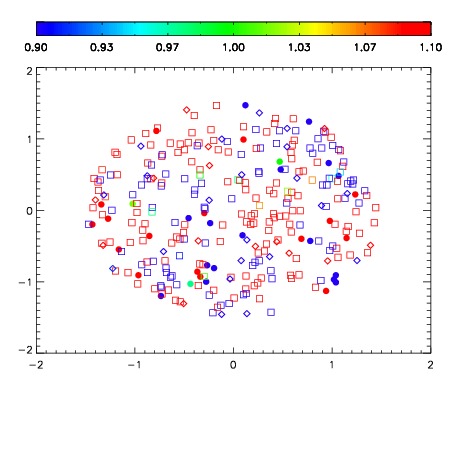
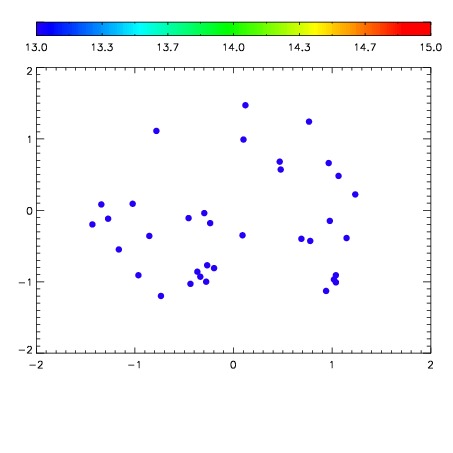

| Frame | Nreads | Zeropoints | Mag plots | Spatial mag deviation | Spatial sky 16325A emission deviations (filled: sky, open: star) | Spatial sky continuum emission | Spatial sky telluric CO2 absorption deviations (filled: H < 10) | |||||||||||||||||||||||
| 0 | 0 |
|
|
|
|
|
|
| IPAIR | NAME | SHIFT | NEWSHIFT | S/N | NAME | SHIFT | NEWSHIFT | S/N |
| 0 | 03140086 | 0.512254 | 0.00000 | 17.4669 | 03140091 | -0.000152434 | 0.512406 | 17.9952 |
| 1 | 03140085 | 0.509168 | 0.00308597 | 17.8273 | 03140084 | 0.00000 | 0.512254 | 18.2939 |
| 2 | 03140090 | 0.510898 | 0.00135601 | 17.3628 | 03140088 | 0.00918970 | 0.503064 | 17.3658 |
| 3 | 03140089 | 0.506211 | 0.00604302 | 17.0595 | 03140087 | 0.0103038 | 0.501950 | 17.3067 |