| Red | Green | Blue | |
| z | 17.64 | ||
| znorm | Inf | ||
| sky | -NaN | -NaN | -Inf |
| S/N | 28.2 | 47.9 | 52.9 |
| S/N(c) | 0.0 | 0.0 | 0.0 |
| SN(E/C) |
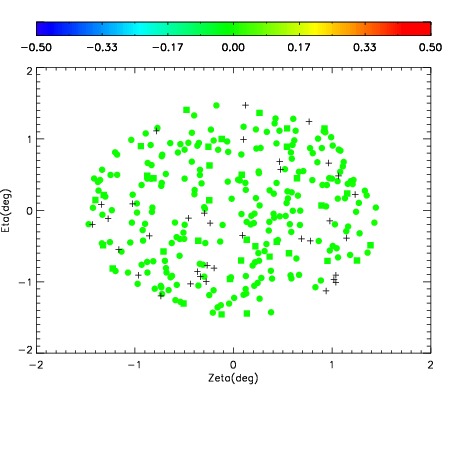
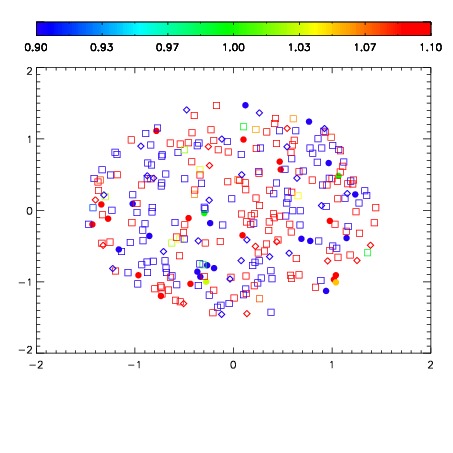
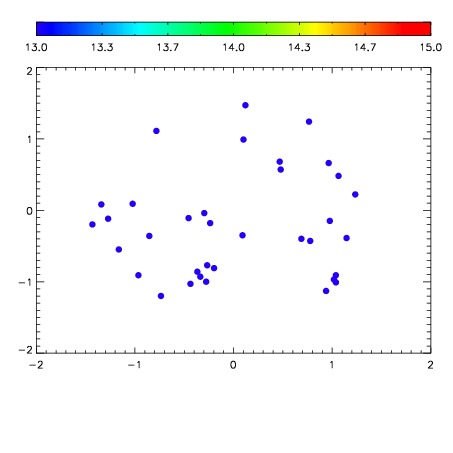

| Frame | Nreads | Zeropoints | Mag plots | Spatial mag deviation | Spatial sky 16325A emission deviations (filled: sky, open: star) | Spatial sky continuum emission | Spatial sky telluric CO2 absorption deviations (filled: H < 10) | |||||||||||||||||||||||
| 0 | 0 |
|
|
|
|
|
|
| IPAIR | NAME | SHIFT | NEWSHIFT | S/N | NAME | SHIFT | NEWSHIFT | S/N |
| 0 | 03190073 | 0.513735 | 0.00000 | 18.9916 | 03190074 | 0.00161062 | 0.512124 | 18.9611 |
| 1 | 03190069 | 0.502950 | 0.0107850 | 19.0736 | 03190067 | 0.00000 | 0.513735 | 19.0426 |
| 2 | 03190068 | 0.501898 | 0.0118370 | 19.0691 | 03190070 | 0.000202635 | 0.513532 | 18.9918 |
| 3 | 03190072 | 0.502718 | 0.0110170 | 19.0167 | 03190071 | -0.000650121 | 0.514385 | 18.9839 |