| Red | Green | Blue | |
| z | 17.64 | ||
| znorm | Inf | ||
| sky | -Inf | -Inf | -Inf |
| S/N | 25.2 | 44.4 | 49.7 |
| S/N(c) | 0.0 | 0.0 | 0.0 |
| SN(E/C) |
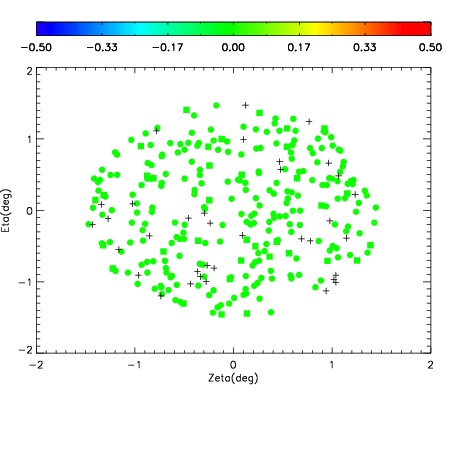
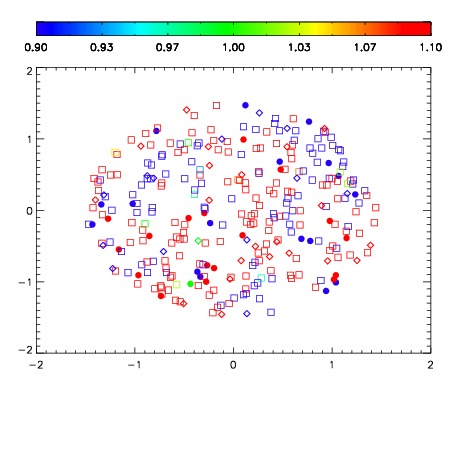
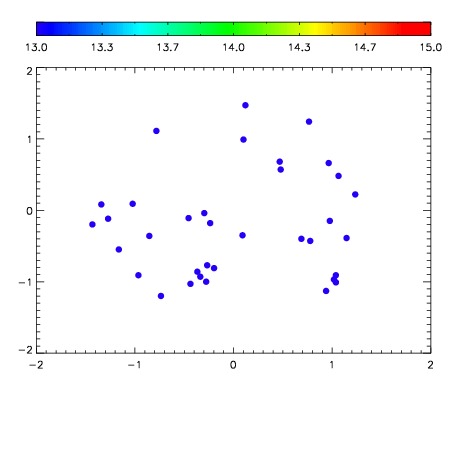

| Frame | Nreads | Zeropoints | Mag plots | Spatial mag deviation | Spatial sky 16325A emission deviations (filled: sky, open: star) | Spatial sky continuum emission | Spatial sky telluric CO2 absorption deviations (filled: H < 10) | |||||||||||||||||||||||
| 0 | 0 |
|
|
|
|
|
|
| IPAIR | NAME | SHIFT | NEWSHIFT | S/N | NAME | SHIFT | NEWSHIFT | S/N |
| 0 | 03400042 | 0.503555 | 0.00000 | 18.7722 | 03400043 | 0.00295453 | 0.500600 | 18.7062 |
| 1 | 03400037 | 0.495979 | 0.00757599 | 19.1134 | 03400036 | 0.00000 | 0.503555 | 19.1302 |
| 2 | 03400038 | 0.497562 | 0.00599301 | 19.0959 | 03400039 | 0.00243790 | 0.501117 | 19.0392 |
| 3 | 03400041 | 0.500166 | 0.00338900 | 18.8723 | 03400040 | 4.07860e-05 | 0.503514 | 18.8838 |