| Red | Green | Blue | |
| z | 17.65 | ||
| znorm | Inf | ||
| sky | -Inf | -Inf | -NaN |
| S/N | 2.9 | 5.8 | 5.1 |
| S/N(c) | 0.0 | 0.0 | 0.0 |
| SN(E/C) |
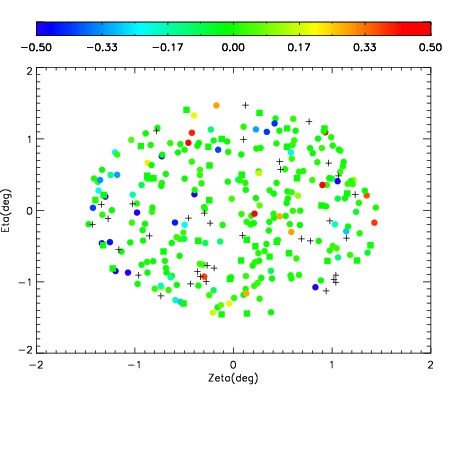
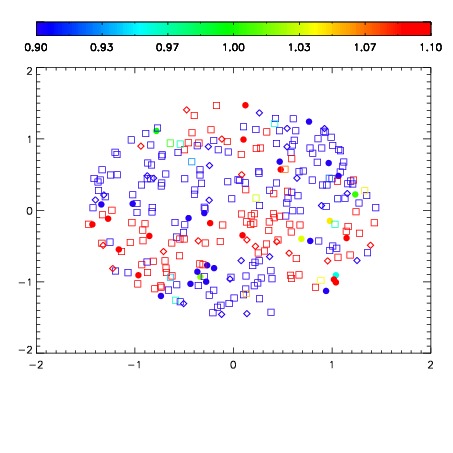


| Frame | Nreads | Zeropoints | Mag plots | Spatial mag deviation | Spatial sky 16325A emission deviations (filled: sky, open: star) | Spatial sky continuum emission | Spatial sky telluric CO2 absorption deviations (filled: H < 10) | |||||||||||||||||||||||
| 0 | 0 |
|
|
|
|
|
|
| IPAIR | NAME | SHIFT | NEWSHIFT | S/N | NAME | SHIFT | NEWSHIFT | S/N |
| 0 | 03500042 | 0.511872 | 0.00000 | 16.5213 | 03500048 | 0.000396971 | 0.511475 | 15.4185 |
| 1 | 03500041 | 0.504369 | 0.00750297 | 17.0011 | 03500040 | 0.00000 | 0.511872 | 16.6264 |
| 2 | 03500045 | 0.503496 | 0.00837600 | 15.7725 | 03500043 | -0.000315656 | 0.512188 | 15.3025 |