| Red | Green | Blue | |
| z | 17.64 | ||
| znorm | Inf | ||
| sky | -Inf | -Inf | -Inf |
| S/N | 17.4 | 32.1 | 34.2 |
| S/N(c) | 0.0 | 0.0 | 0.0 |
| SN(E/C) |
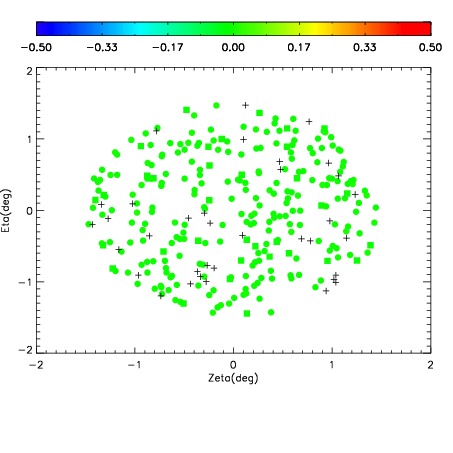
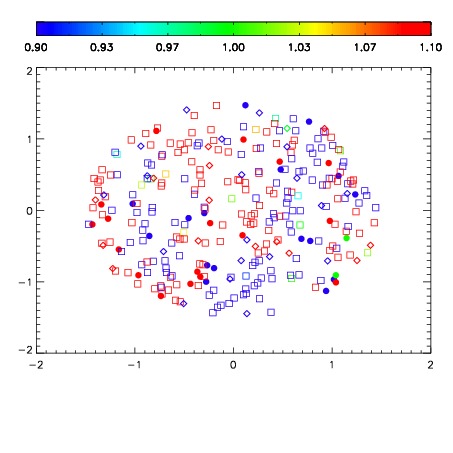
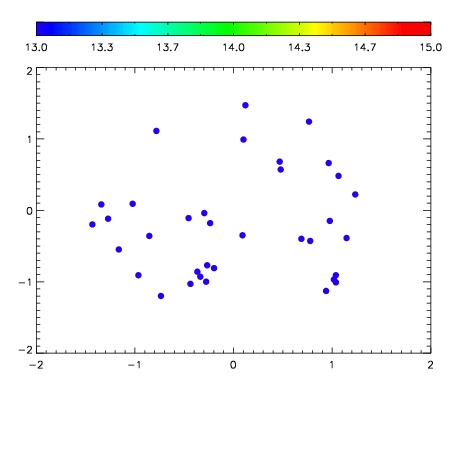

| Frame | Nreads | Zeropoints | Mag plots | Spatial mag deviation | Spatial sky 16325A emission deviations (filled: sky, open: star) | Spatial sky continuum emission | Spatial sky telluric CO2 absorption deviations (filled: H < 10) | |||||||||||||||||||||||
| 0 | 0 |
|
|
|
|
|
|
| IPAIR | NAME | SHIFT | NEWSHIFT | S/N | NAME | SHIFT | NEWSHIFT | S/N |
| 0 | 03760057 | 0.511870 | 0.00000 | 18.2619 | 03760054 | 0.00126459 | 0.510605 | 18.4284 |
| 1 | 03760056 | 0.510713 | 0.00115705 | 18.4487 | 03760055 | 0.000175943 | 0.511694 | 18.6848 |
| 2 | 03760052 | 0.508643 | 0.00322706 | 18.4461 | 03760058 | 0.000378319 | 0.511492 | 18.6136 |
| 3 | 03760053 | 0.509830 | 0.00204003 | 18.2939 | 03760051 | 0.00000 | 0.511870 | 18.4448 |