| Red | Green | Blue | |
| z | 17.64 | ||
| znorm | Inf | ||
| sky | -Inf | -Inf | -NaN |
| S/N | 27.7 | 44.8 | 47.9 |
| S/N(c) | 0.0 | 0.0 | 0.0 |
| SN(E/C) |
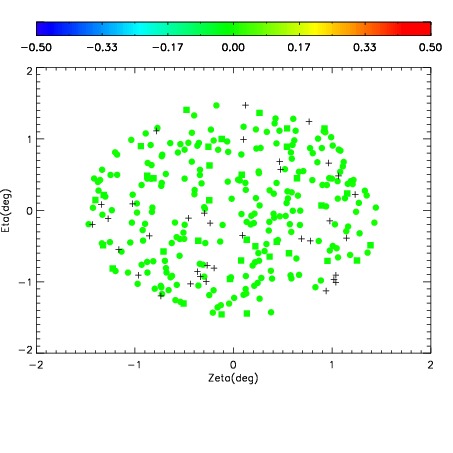
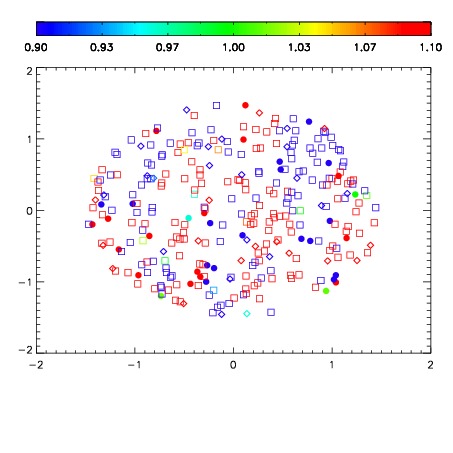
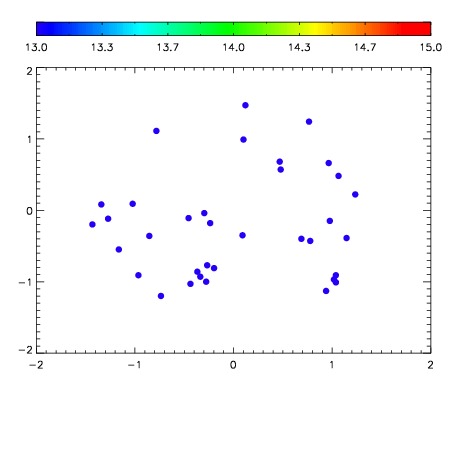

| Frame | Nreads | Zeropoints | Mag plots | Spatial mag deviation | Spatial sky 16325A emission deviations (filled: sky, open: star) | Spatial sky continuum emission | Spatial sky telluric CO2 absorption deviations (filled: H < 10) | |||||||||||||||||||||||
| 0 | 0 |
|
|
|
|
|
|
| IPAIR | NAME | SHIFT | NEWSHIFT | S/N | NAME | SHIFT | NEWSHIFT | S/N |
| 0 | 03770042 | 0.512509 | 0.00000 | 18.8053 | 03770043 | 0.00463221 | 0.507877 | 18.7797 |
| 1 | 03770038 | 0.507427 | 0.00508201 | 19.0624 | 03770039 | 0.00107746 | 0.511432 | 19.0744 |
| 2 | 03770037 | 0.506192 | 0.00631696 | 19.0343 | 03770040 | 0.00339098 | 0.509118 | 19.0706 |
| 3 | 03770041 | 0.511726 | 0.000782967 | 18.9611 | 03770036 | 0.00000 | 0.512509 | 19.0027 |