| Red | Green | Blue | |
| z | 17.64 | ||
| znorm | Inf | ||
| sky | -Inf | -Inf | -Inf |
| S/N | 31.4 | 52.4 | 56.2 |
| S/N(c) | 0.0 | 0.0 | 0.0 |
| SN(E/C) |
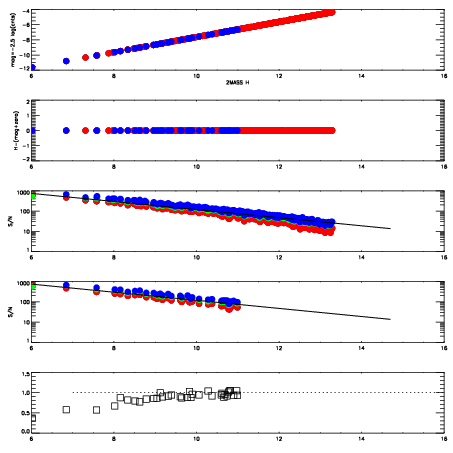
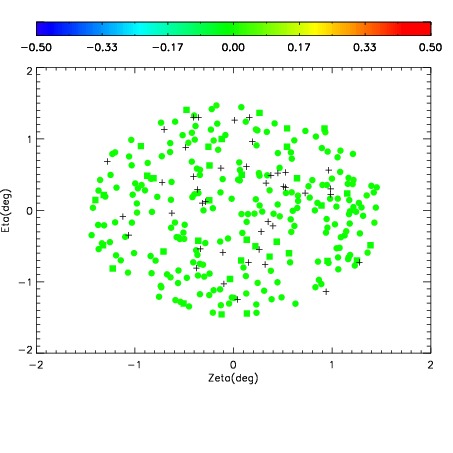
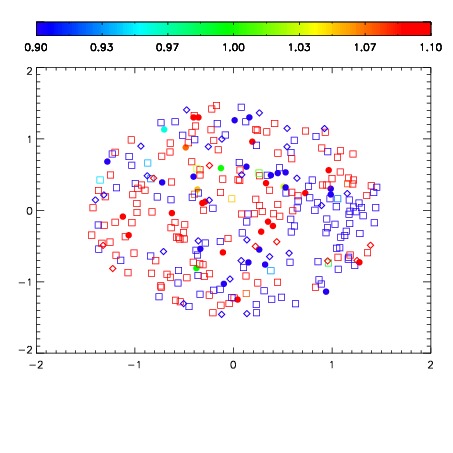
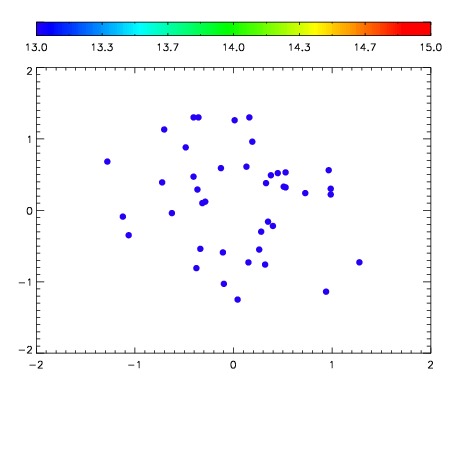

| Frame | Nreads | Zeropoints | Mag plots | Spatial mag deviation | Spatial sky 16325A emission deviations (filled: sky, open: star) | Spatial sky continuum emission | Spatial sky telluric CO2 absorption deviations (filled: H < 10) | |||||||||||||||||||||||
| 0 | 0 |
|
|
|
|
|
|
| IPAIR | NAME | SHIFT | NEWSHIFT | S/N | NAME | SHIFT | NEWSHIFT | S/N |
| 0 | 03700066 | 0.498655 | 0.00000 | 19.1348 | 03700067 | 0.00101194 | 0.497643 | 19.1166 |
| 1 | 03700062 | 0.495644 | 0.00301099 | 19.0696 | 03700064 | 0.00141848 | 0.497237 | 19.1040 |
| 2 | 03700061 | 0.493648 | 0.00500700 | 19.0440 | 03700063 | 0.00226370 | 0.496391 | 19.0744 |
| 3 | 03700065 | 0.497234 | 0.00142100 | 19.0046 | 03700060 | 0.00000 | 0.498655 | 18.9934 |