| Red | Green | Blue | |
| z | 17.64 | ||
| znorm | Inf | ||
| sky | -Inf | -Inf | -Inf |
| S/N | 23.9 | 42.4 | 44.5 |
| S/N(c) | 0.0 | 0.0 | 0.0 |
| SN(E/C) |
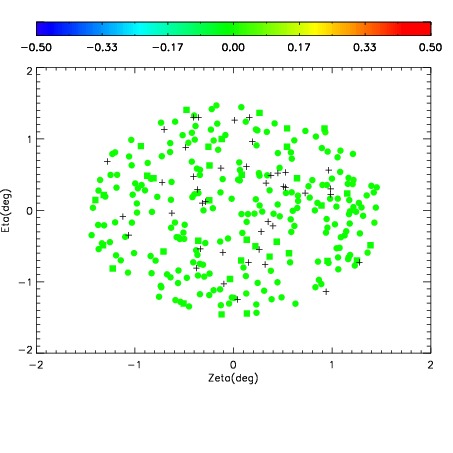
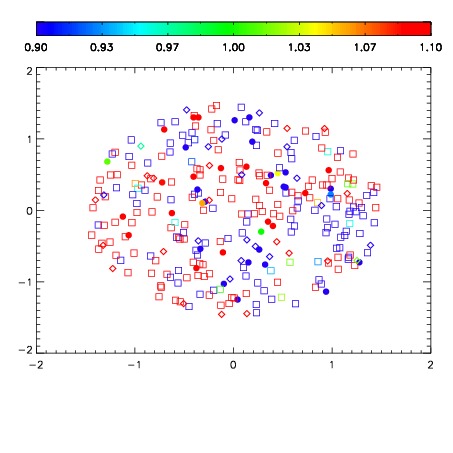


| Frame | Nreads | Zeropoints | Mag plots | Spatial mag deviation | Spatial sky 16325A emission deviations (filled: sky, open: star) | Spatial sky continuum emission | Spatial sky telluric CO2 absorption deviations (filled: H < 10) | |||||||||||||||||||||||
| 0 | 0 |
|
|
|
|
|
|
| IPAIR | NAME | SHIFT | NEWSHIFT | S/N | NAME | SHIFT | NEWSHIFT | S/N |
| 0 | 03970043 | 0.503315 | 0.00000 | 18.7650 | 03970042 | 0.00324311 | 0.500072 | 18.8410 |
| 1 | 03970044 | 0.502629 | 0.000685990 | 18.9721 | 03970045 | 0.00152479 | 0.501790 | 18.9851 |
| 2 | 03970039 | 0.500929 | 0.00238597 | 18.9058 | 03970038 | 0.00000 | 0.503315 | 18.8558 |
| 3 | 03970040 | 0.502682 | 0.000633001 | 18.3961 | 03970041 | 0.00378053 | 0.499534 | 18.1185 |