| Red | Green | Blue | |
| z | 17.64 | ||
| znorm | Inf | ||
| sky | -Inf | -Inf | -Inf |
| S/N | 29.9 | 51.1 | 53.6 |
| S/N(c) | 0.0 | 0.0 | 0.0 |
| SN(E/C) |


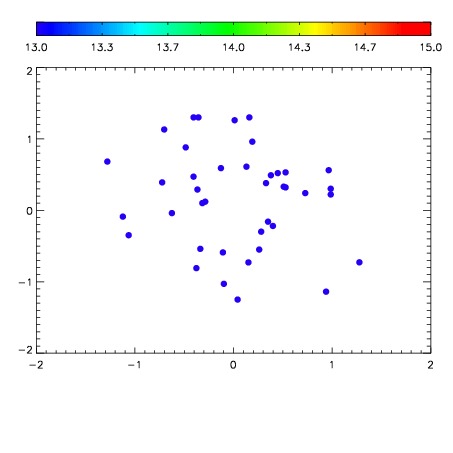

| Frame | Nreads | Zeropoints | Mag plots | Spatial mag deviation | Spatial sky 16325A emission deviations (filled: sky, open: star) | Spatial sky continuum emission | Spatial sky telluric CO2 absorption deviations (filled: H < 10) | |||||||||||||||||||||||
| 0 | 0 |
|
|
|
|
|
|
| IPAIR | NAME | SHIFT | NEWSHIFT | S/N | NAME | SHIFT | NEWSHIFT | S/N |
| 0 | 04570012 | 0.505401 | 0.00000 | 19.0876 | 04570014 | 0.00121868 | 0.504182 | 19.0637 |
| 1 | 04570011 | 0.503597 | 0.00180399 | 19.0441 | 04570013 | 0.00189634 | 0.503505 | 19.0571 |
| 2 | 04570015 | 0.503483 | 0.00191802 | 19.0170 | 04570017 | 0.000790886 | 0.504610 | 19.0229 |
| 3 | 04570016 | 0.504533 | 0.000868022 | 18.9873 | 04570010 | 0.00000 | 0.505401 | 19.0175 |