| Red | Green | Blue | |
| z | 17.64 | ||
| znorm | Inf | ||
| sky | -Inf | -Inf | -Inf |
| S/N | 31.2 | 48.8 | 56.6 |
| S/N(c) | 0.0 | 0.0 | 0.0 |
| SN(E/C) |
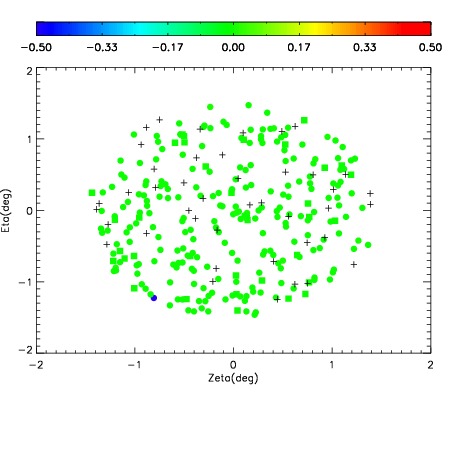
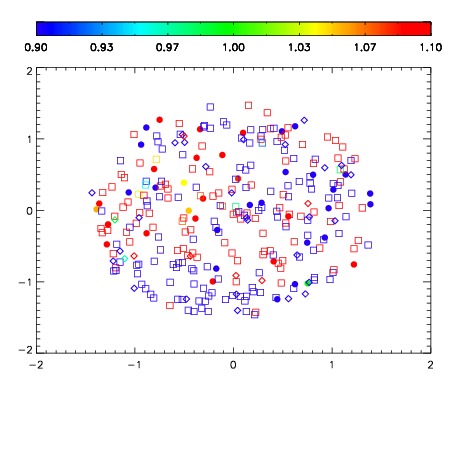
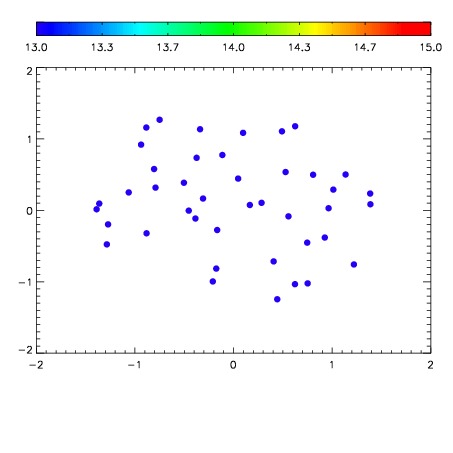

| Frame | Nreads | Zeropoints | Mag plots | Spatial mag deviation | Spatial sky 16325A emission deviations (filled: sky, open: star) | Spatial sky continuum emission | Spatial sky telluric CO2 absorption deviations (filled: H < 10) | |||||||||||||||||||||||
| 0 | 0 |
|
|
|
|
|
|
| IPAIR | NAME | SHIFT | NEWSHIFT | S/N | NAME | SHIFT | NEWSHIFT | S/N |
| 0 | 03420090 | 0.493873 | 0.00000 | 19.2566 | 03420092 | -0.00220064 | 0.496074 | 19.2740 |
| 1 | 03420086 | 0.493658 | 0.000214994 | 19.2596 | 03420091 | 0.000514837 | 0.493358 | 19.2805 |
| 2 | 03420085 | 0.493368 | 0.000505000 | 19.2530 | 03420087 | -0.000246105 | 0.494119 | 19.2575 |
| 3 | 03420089 | 0.492787 | 0.00108600 | 19.1971 | 03420084 | 0.00000 | 0.493873 | 19.2491 |