| Red | Green | Blue | |
| z | 17.64 | ||
| znorm | Inf | ||
| sky | -Inf | -Inf | -Inf |
| S/N | 31.9 | 51.9 | 58.0 |
| S/N(c) | 0.0 | 0.0 | 0.0 |
| SN(E/C) |
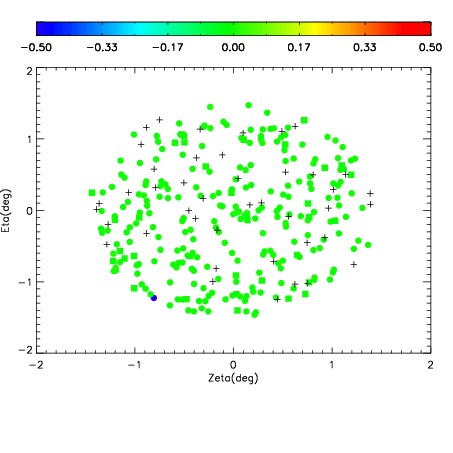
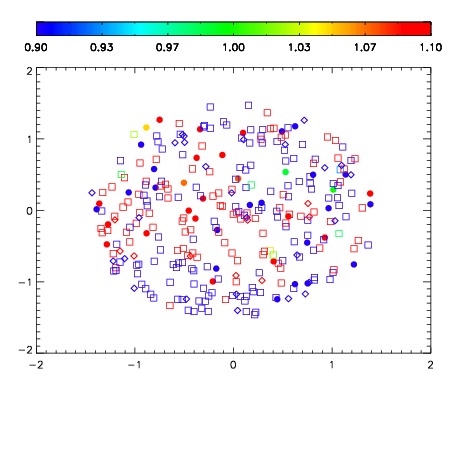
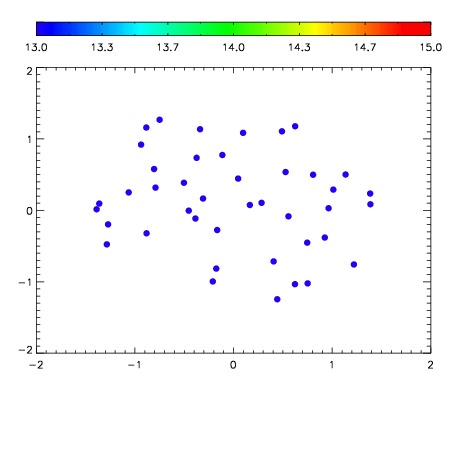

| Frame | Nreads | Zeropoints | Mag plots | Spatial mag deviation | Spatial sky 16325A emission deviations (filled: sky, open: star) | Spatial sky continuum emission | Spatial sky telluric CO2 absorption deviations (filled: H < 10) | |||||||||||||||||||||||
| 0 | 0 |
|
|
|
|
|
|
| IPAIR | NAME | SHIFT | NEWSHIFT | S/N | NAME | SHIFT | NEWSHIFT | S/N |
| 0 | 03430103 | 0.516649 | 0.00000 | 19.0337 | 03430097 | 0.00000 | 0.516649 | 19.0885 |
| 1 | 03430099 | 0.514171 | 0.00247800 | 19.1305 | 03430100 | 0.00117809 | 0.515471 | 19.1702 |
| 2 | 03430098 | 0.510719 | 0.00593001 | 19.1006 | 03430101 | -0.000372011 | 0.517021 | 19.1227 |
| 3 | 03430102 | 0.512266 | 0.00438303 | 19.0661 | 03430105 | 0.000829456 | 0.515820 | 19.1090 |
| 4 | 03430106 | 0.511849 | 0.00480002 | 18.9658 | 03430104 | 0.00158717 | 0.515062 | 19.0570 |