| Red | Green | Blue | |
| z | 17.64 | ||
| znorm | Inf | ||
| sky | -Inf | -Inf | -Inf |
| S/N | 29.1 | 49.0 | 51.8 |
| S/N(c) | 0.0 | 0.0 | 0.0 |
| SN(E/C) |
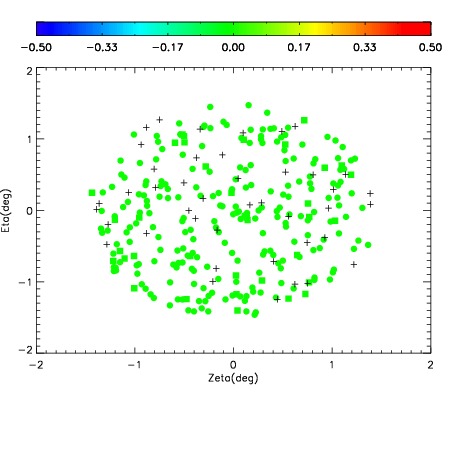
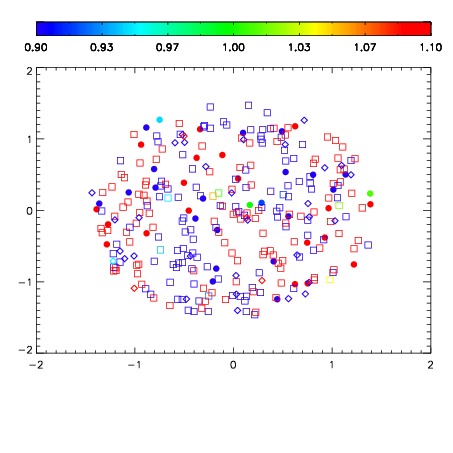
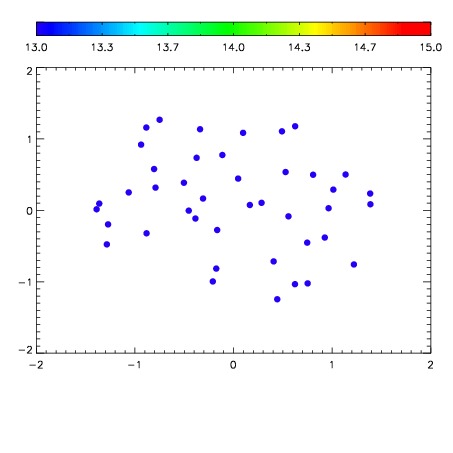

| Frame | Nreads | Zeropoints | Mag plots | Spatial mag deviation | Spatial sky 16325A emission deviations (filled: sky, open: star) | Spatial sky continuum emission | Spatial sky telluric CO2 absorption deviations (filled: H < 10) | |||||||||||||||||||||||
| 0 | 0 |
|
|
|
|
|
|
| IPAIR | NAME | SHIFT | NEWSHIFT | S/N | NAME | SHIFT | NEWSHIFT | S/N |
| 0 | 03700088 | 0.512660 | 0.00000 | 19.1219 | 03700082 | 0.00000 | 0.512660 | 19.0634 |
| 1 | 03700087 | 0.504937 | 0.00772303 | 19.1342 | 03700089 | -0.000970043 | 0.513630 | 19.1547 |
| 2 | 03700084 | 0.510288 | 0.00237203 | 19.1275 | 03700085 | 0.00179270 | 0.510867 | 19.1487 |
| 3 | 03700083 | 0.506557 | 0.00610304 | 19.1229 | 03700086 | -5.89477e-05 | 0.512719 | 19.1382 |