| Red | Green | Blue | |
| z | 17.64 | ||
| znorm | Inf | ||
| sky | -Inf | -Inf | -Inf |
| S/N | 17.6 | 33.5 | 35.5 |
| S/N(c) | 0.0 | 0.0 | 0.0 |
| SN(E/C) |
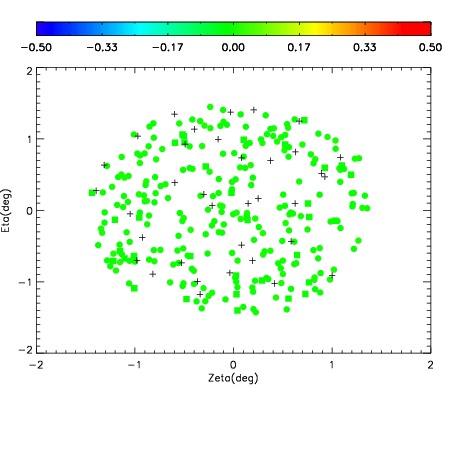
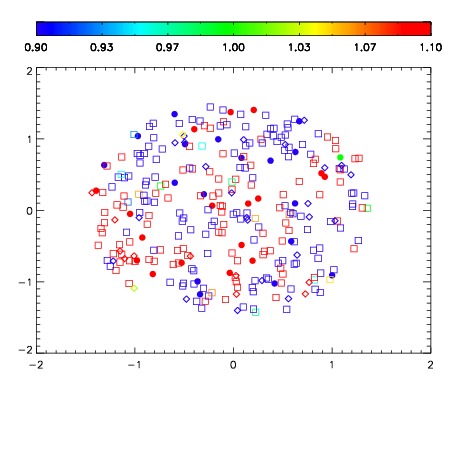


| Frame | Nreads | Zeropoints | Mag plots | Spatial mag deviation | Spatial sky 16325A emission deviations (filled: sky, open: star) | Spatial sky continuum emission | Spatial sky telluric CO2 absorption deviations (filled: H < 10) | |||||||||||||||||||||||
| 0 | 0 |
|
|
|
|
|
|
| IPAIR | NAME | SHIFT | NEWSHIFT | S/N | NAME | SHIFT | NEWSHIFT | S/N |
| 0 | 03760083 | 0.512914 | 0.00000 | 18.6287 | 03760081 | -0.000703425 | 0.513617 | 18.5792 |
| 1 | 03760082 | 0.510200 | 0.00271398 | 18.6568 | 03760084 | 0.000716414 | 0.512198 | 18.6900 |
| 2 | 03760079 | 0.509767 | 0.00314701 | 18.6024 | 03760080 | 0.000400635 | 0.512513 | 18.4850 |
| 3 | 03760078 | 0.509274 | 0.00364000 | 18.5445 | 03760077 | 0.00000 | 0.512914 | 18.4328 |